This isn’t just a journal — it’s your profit booster.
Stop the losses, make room for profits
Stay in control, stay ahead. Our trading journal helps you focus on what works, refine your edge, and reach your full potential — with clarity, consistency, and confidence. It’s more than just a tracker — it’s your daily partner for smarter decisions, stronger habits, and long-term growth. Whether you’re fine-tuning your strategy or scaling your results, this is your space to think clearly, act with purpose, and trade at your best.


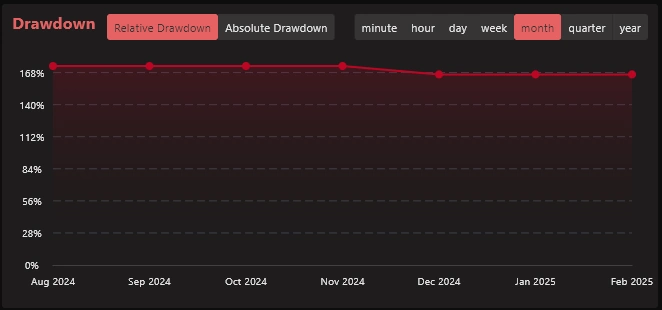
Drawdown – Your Essential Tool to Limit Losses… and So Much More
Drawdown is the essential tool to limit your losses… but also to improve your discipline, your strategy, and your longevity as a trader.
But it’s also where the real difference lies — between a trader who survives… and one who truly succeeds.
Our drawdown tool isn’t just a chart: it’s a mirror of your risk, your consistency, and your self-control.
It helps you understand how far you can go without putting your capital — or your mindset — in danger.
- Anticipate losses instead of suffering them
- Learn to stabilize your performance
- Adopt a more thoughtful, more resilient trading style
- Spot negative trends before they become fatal
- Gain confidence and endurance
Because in trading, it’s not the one who makes the biggest gains who wins…
It’s the one who knows how to protect what they’ve already built.
Master your drawdown. Master your future.
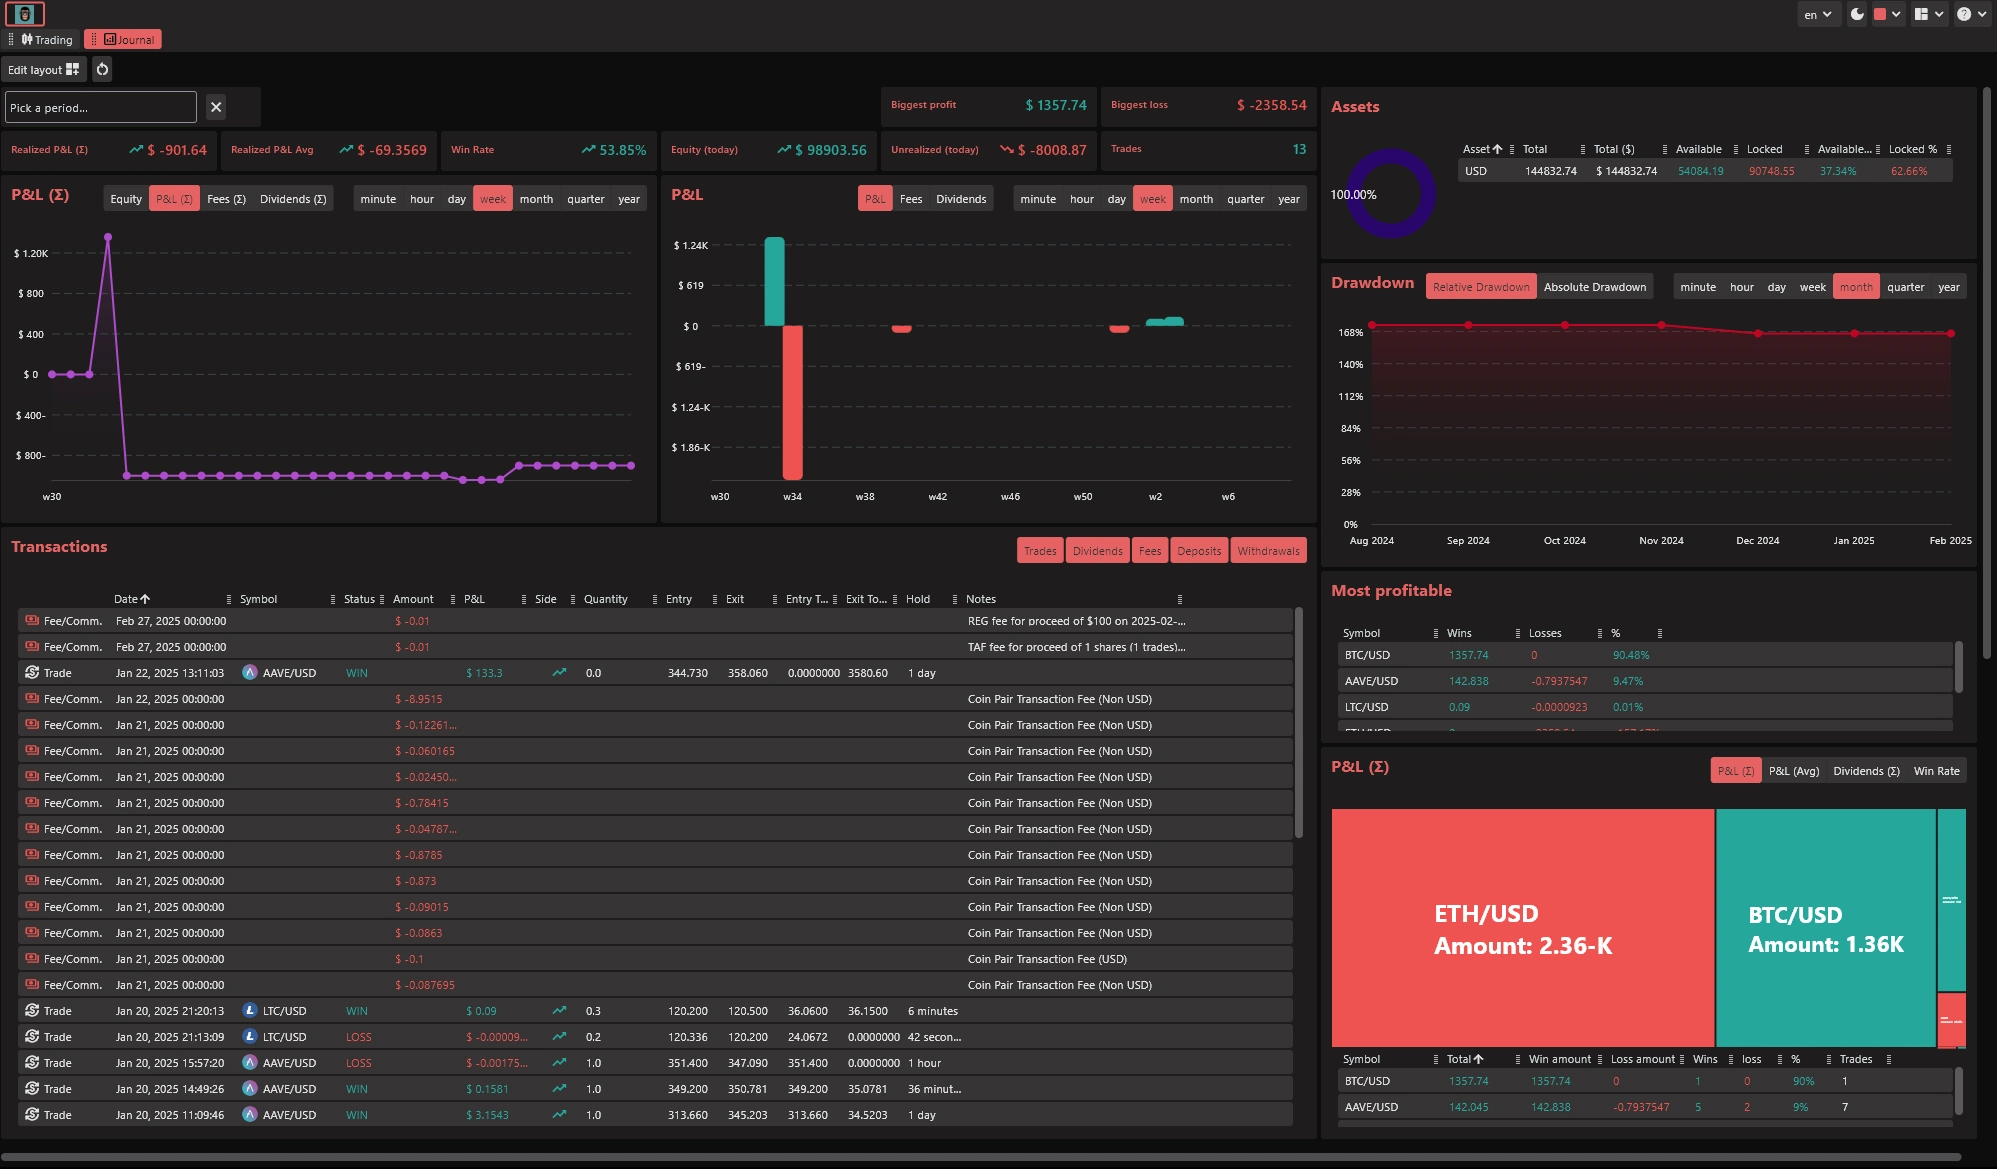
P&L (Profit & Loss) shows your cumulative gains and losses —
it’s the direct result of your trading decisions, the line that tells your story.
Equity reflects the real-time value of your account, including open positions, floating profits/losses, and fees.
It’s your true current wealth — whether realized or still in play.
Tracking your P&L and equity isn’t just about watching numbers rise or fall —
it’s about understanding how your performance is built, trade after trade, day after day.
Our tool helps you:
- Visualize the real growth of your capital
- Spot instability, overexposure, or stagnation
- Identify key moments that shaped your results
- Separate short-term spikes from long-term progress
- Align your strategy with your real financial goals
Because a good trade isn’t just about profit — it’s about how it shapes your overall journey.
By understanding your P&L and equity curves, you make better decisions,
gain more clarity, consistency… and confidence.
Let your results speak — but above all, learn to listen to them.
Realized P&L / Equity evolution
ADVANCED BUT SECONDARY METRICS – For Detail Lovers
Flows.Trading offers a full suite of advanced metrics for detail lovers — from Unrealized P&L, Biggest Profit/Loss, and Trade Count, to heatmaps, symbol rankings, and detailed P&L evolution over time.
Realized P&L
Instantly see how much you’ve actually gained or lost.
Realized P&L shows the outcome of closed trades only — no guesswork.
It helps you measure true performance and progress over time. Stay grounded in facts, not floating profits.
Avg Realized P&L
Know What You Actually Take Home
It shows how much you earn per closed trade. It helps you measure consistency and improve decision-making.
Focus on real results — not just open potential.
Equity
Track Your True Account Value
Equity reflects your real-time account value, including open positions.
It helps you manage risk, spot drawdowns, and stay in control.
A clear view of your equity keeps your strategy grounded.
Unrealized
Unrealized P&L shows the value of your open trades in real time. It helps you make timely exits, manage emotions, and protect profits.
Don’t just look back — stay sharp while you’re in the trade.
Biggest Profit
Your biggest profit reveals what worked best — strategy, timing, or setup. Use it to identify repeatable patterns and boost your confidence.
Success leaves clues — learn from your top trade.
Biggest Loss
Your biggest loss highlights where things went wrong. It’s a key metric to refine your strategy and your risk.
Growth starts by understanding what to avoid.
Win Rate
Measure How Often You Win
Your win rate shows the percentage of trades that end in profit. It helps you evaluate your strategy’s consistency and efficiency.
Track it to stay objective and improve your edge.

And more...
Track what works. Amplify what wins.
Real-time & automatic syncronization
No more manual input, Focus on trading. Our journal syncs automatically with your broker in real-time — no spreadsheets, no copy-paste. Just seamless tracking that saves you time and keeps your performance data always up to date.
Turn insights into consistent results.
Great trades start with great awareness. Use powerful analytics and clear visuals to transform raw data into smart decisions. Build the habits that lead to growth — one insight, one trade, one win at a time.
Period Analysis – From Year to Minute
Zoom in or out — instantly. Whether you’re reviewing yearly performance or analyzing a single trade minute-by-minute, our journal gives you full control. Spot trends, compare periods, and make decisions with precision.
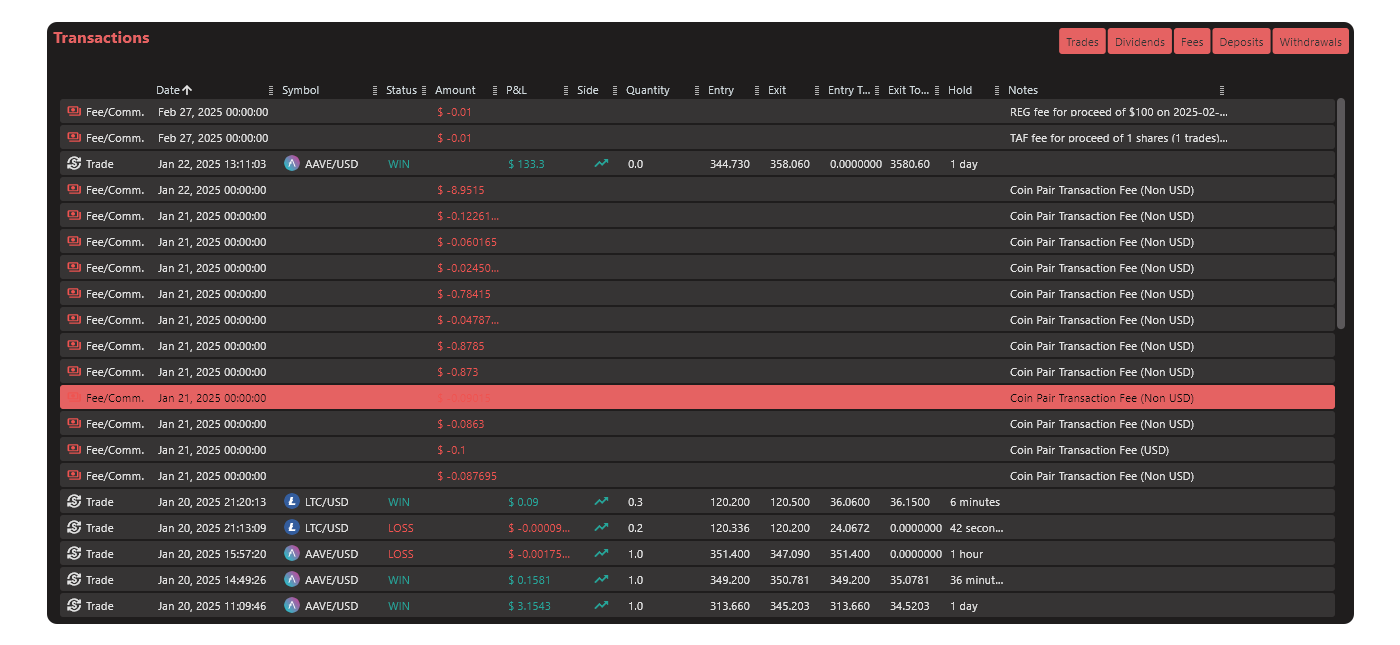
No more scattered spreadsheets. Flows.Trading Journal keeps a detailed list of every transaction, including:
Trades
Dividends
Fees
Deposits & Withdrawals

TRANSACTION HISTORY – A Ledger You Can Trust
faqEverything you need
to know about
A trading journal is a powerful tool that helps you reflect on your trades, spot patterns, and improve your strategy over time. It gives you clarity, consistency, and insight — three essential ingredients for long-term success in trading.
Most journals rely on manual input and offer isolated features. Ours is fully integrated with your broker and with the entire Flows.Trading platform — including charts, technical tools, and more. This means seamless data flow, smarter insights, and a unified experience built for serious traders.
Yes — for supported brokers, trades are synced automatically in real time via direct integration. No manual entry needed. And we’re continuously expanding compatibility to cover even more brokers, so you can just focus on trading.
Absolutely. Whether you’re on desktop, tablet, or mobile, your data stays synced and accessible from anywhere. Analyze your performance, review your trades, or check stats — anytime, any device.
Our journal highlights patterns in your trading behavior, filters your best-performing setups, and visualizes key metrics across timeframes. This makes it easier to double down on what works and continuously optimize your approach.
Yes — from yearly summaries to minute-level analysis. Our period analysis feature lets you zoom in and out effortlessly, compare trends, and understand your results with precision across any timeframe.