Advanced Charting Tools – Draw, Measure, Analyze with Flows.Trading
Discover a complete suite of technical analysis tools designed for active traders. Whether you’re analyzing price action, volume structures, time cycles, or key levels, Flows.Trading gives you a fluid, powerful and enjoyable experience.
Here’s a detailed look at all the tools you can use today.
Consistent profit tools
Analyze Smarter.
Trade Better.
Flows.Trading.

Empowering Traders with advanced charting tools to decode market behavior, refine strategies, and make confident, data-driven decisions.


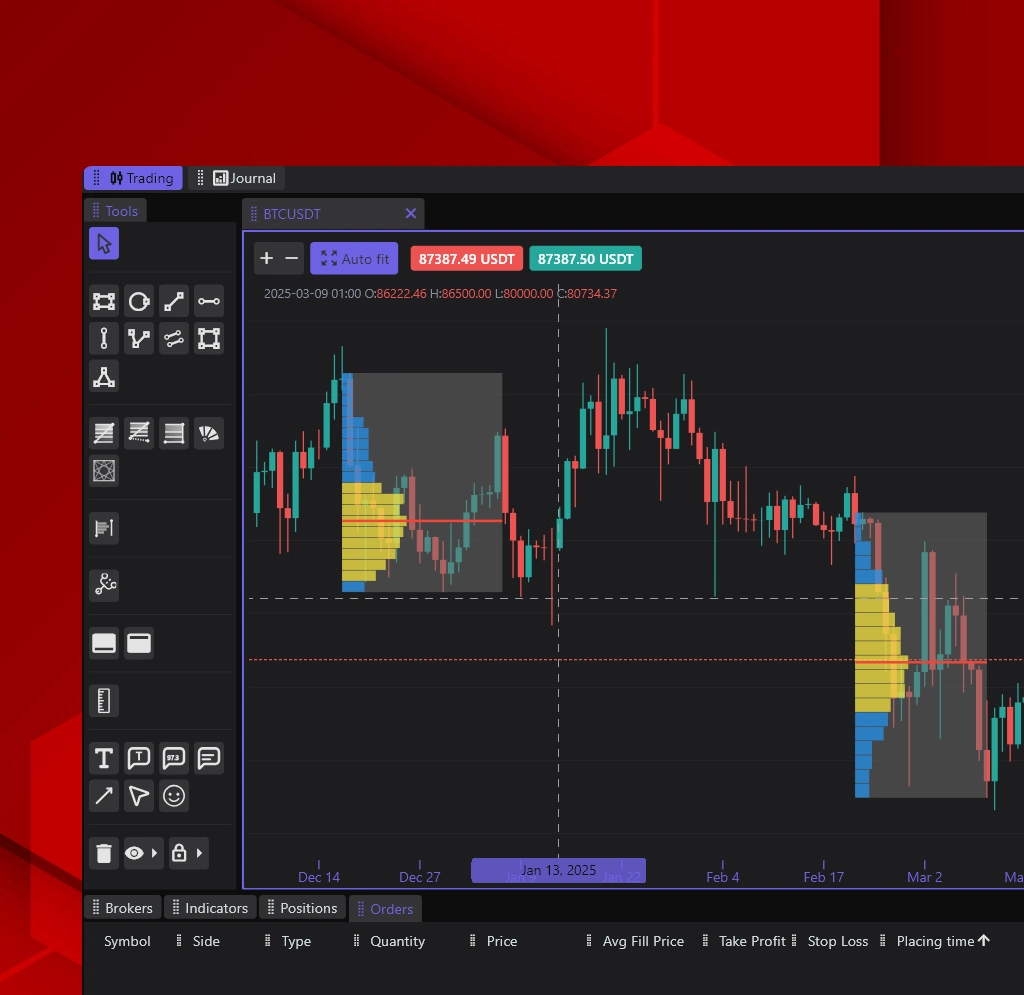
featuresVolume Profile: Understand Where the Market Built Value
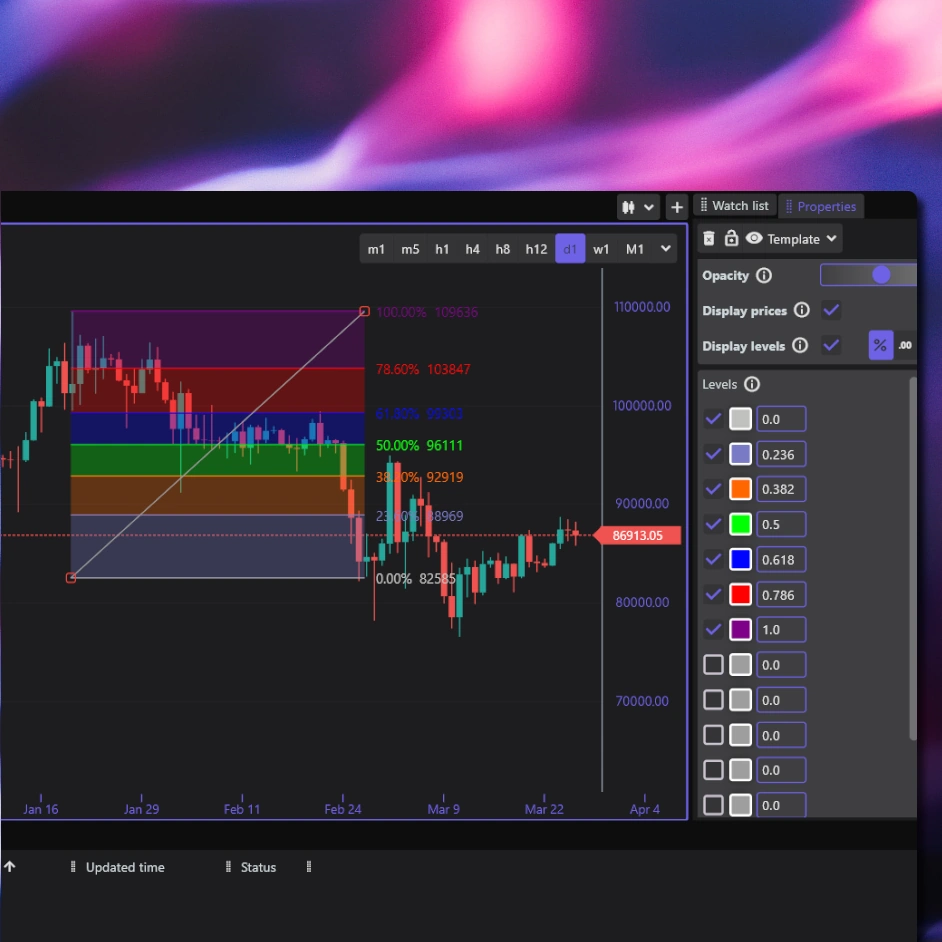
how it worksFibonacci, Gann & Projection Tools
Take your forecasting to the next level with precision-based projection tools.
Unlock the Full Power of Fibonacci Tools
Take control with fully editable Retracements, customizable Extension levels, and dynamic Fibonacci Channels. Precision tools designed to elevate your trading—ready to test, built to impress.
Master the Markets with Gann Tools
Harness the precision of the Gann Fan and Gann Box to uncover key price-time relationships. Fully interactive and built for serious traders—test them now and level up your strategy.
Sharpen Your Edge with Andrews' Pitchfork
Plot powerful trend channels with precision using the fully adjustable Andrews’ Pitchfork. A must-have tool for spotting reversals and riding trends like a pro.

servicesDrawing Tools & Technical Shapes
Master the Trend
Draw the story of price. Trend lines, horizontal and vertical levels, and parallel lines help you visualize support, resistance, and market direction. They're essential for spotting breakouts, trend reversals, and key zones.
Shape the Market
Highlight key structures. Use rectangles, triangles, circles, and quads to define consolidation zones, chart patterns, and areas of interest. Perfect for technical setups like wedges, flags, or ranges.
Measure for Precision
Every pip and second counts. Use the measuring tool to check price movement and time intervals in one glance. Great for confirming targets, risk/reward, or trade durations.
Free Your Mind
Sketch your own vision. Whether it's a quick highlight or an advanced chart sketch, tools like freeform path, segments, and arrows give you full creative freedom. Ideal for personalized analysis.
Say It on the Chart
Communicate like a pro. Add text, comments, callouts, and price markers to annotate your ideas directly on the chart. Ideal for sharing setups or keeping a visual trade journal.
Mark the Moment
Leave a visual trace. Icons and markers let you quickly highlight entries, exits, alerts, zones or patterns. Clean, clear, and instantly noticeable during live trading.
Teach & Share
Add the Final Touch
Refine your chart like a pro. Use circles, vertical lines, or subtle arrows to subtly guide attention or add visual balance. Great for polishing your final chart layout.
Chart Your Way: A World of Perspectives at Your Fingertips
Whether you’re a price action purist or a trend-spotting strategist, having multiple chart types is not just a luxury — it’s a game-changer. From classic OHLC to smooth Heikin Ashi, from step lines to area charts, each view offers a unique lens on the market.
Why does it matter? Because every trader sees the market differently. Some want precision, others want clarity. Some want to feel the momentum, others the raw structure. By supporting a wide variety of chart types — Hollow Candlesticks, Line with Markers, OC/HL charts and more — we let you choose the best perspective to trade with confidence.
Explore patterns – Confirm trends – Eliminate noise
Heikin Ashi
Professional
Analysis
See the markets through a prism — multiple perspectives, one clear vision

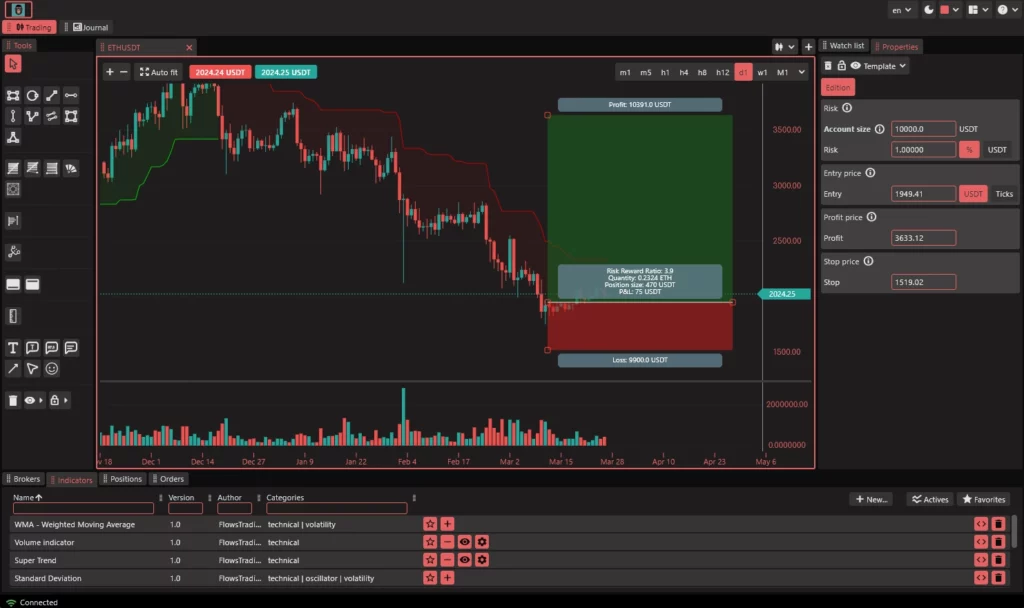
Evaluate Risk & Reward Before You Trade - Trade Simulation Tools

Plan It. See It. Trade It.
Simulate your trades with precision using our built-in Long & Short Position tools. Instantly visualize entries, exits, stop-losses, and profit targets — all with clear R/R ratios and color-coded zones. Take control of your strategy before you hit the market.
faqEverything you need
to know about
We currently support the following chart types:
- Japanese Candlesticks
- Hollow Candlesticks
- Heikin Ashi
- Line
- Line with Markers
- Step Line
- Area
- OHLC (Open-High-Low-Close)
- OC (Open-Close)
- HL (High-Low)
Yes. All drawing tools work across all timeframes and markets, whether you’re trading crypto, forex, stocks, or indices.
Absolutely. Drawings are saved automatically per asset and layout. You can also:
- Create reusable styles / templates
Lock/unlock drawings
Duplicate or delete them
Group them for cleaner organization
Yes. The Fibonacci retracement and extension tools allow:
Custom levels (e.g. 23.6%, 38.2%, 78.6%, etc.)
Custom colors and thickness for each level
Visibility toggles for specific levels
Volume Profile is range-based. You can:
Select a custom range with your mouse
Adjust resolution (number of rows)
View POC, Value Area High, and Value Area Low
Customize the visual style (colors, line width, etc.)
We are also working on session-based and fixed-range profiles.
The Gann Box is a time and price projection tool. Our implementation lets you:
Define both vertical and horizontal scale
Use fixed or custom scaling ratios
Overlay it across any timeframe or asset
It’s ideal for time-based strategies and harmonic traders.