Technical vs. Fundamental Analysis: A Beginner’s Guide
Table of Contents
What is Technical Analysis?
Ever wondered how savvy investors peek into the future of investments? Technical analysis provides a compelling method, scrutinizing past market data—primarily price and volume—to uncover potential insights. It’s a distinct approach from fundamental analysis, which focuses on a company’s financial health; instead, technical analysts believe that historical price patterns hold valuable clues about what might unfold next. You see, trading often exhibits repeating patterns, essentially reflecting all available information within the price itself.
Traders frequently utilize charts and helpful indicators to identify trends, crucial support and resistance levels, and opportune moments for buying or selling. The ultimate aim? To anticipate future price movements and make informed, profitable decisions. Some popular tools include moving averages, the relative strength index (RSI), and Fibonacci retracements—all designed to reveal hidden opportunities.
Core Principles of Technical Analysis
Technical analysis offers some really useful principles for looking at securities. Ever noticed how prices seem to bounce off certain levels? Those are often called support and resistance – potential barriers where buying or selling might take a breather. Spotting established trends, whether they’re rising bullish patterns or falling bearish ones, can be incredibly helpful in making trade decisions. And those chart patterns—like head and shoulders or triangles—can sometimes give you clues about what might happen next. Keep in mind though, these are just indicators; nothing’s guaranteed! It relies on historical data, mostly price and volume, but combining it with other strategies can definitely boost your chances.
Price Action: Understanding Trends and Patterns
Price action trading is all about watching the market – no need for confusing indicators! It’s really about spotting those visual cues, like uptrends or downtrends. Recognizing patterns such as head and shoulders or triangles can hint at potential shifts. Understanding these visuals offers valuable insights.
These common patterns often give clues about what’s coming next; triangles, for instance, frequently signal a consolidation period before prices break out. Head & shoulders usually indicate a trend reversal. Mastering this technical analysis approach helps traders react swiftly and make smarter decisions.
Charting Tools & Timeframes
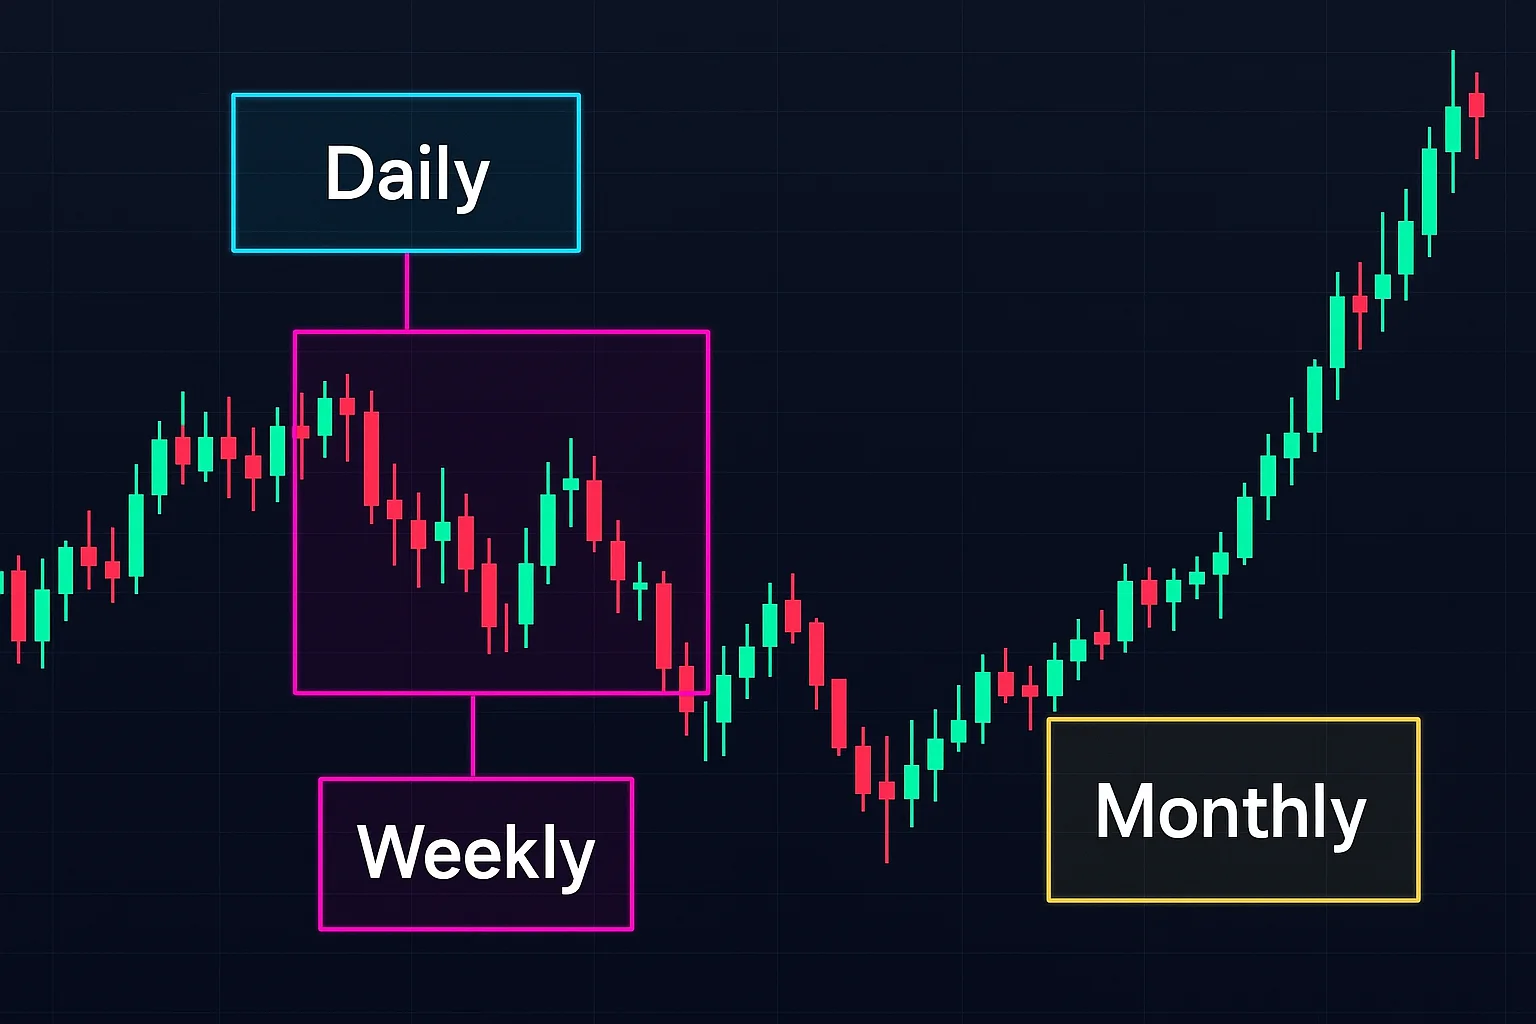
Successful technical analysis really hinges on picking the right charting tools and timeframes. Think about it – daily charts highlight rapid shifts, whereas weekly or monthly views showcase broader trends. It’s all about finding what works for you! Plus, various chart types—like line, bar, and especially candlestick charts—offer distinct perspectives; those candlesticks, for example, give a clear picture of open, high, low, and close prices, aiding smarter trading within technical analysis.
Common Technical Indicators Explained
Traders often rely on technical indicators to get a better feel for market trends – they’re really helpful tools! Moving Averages are great for smoothing out price data, so you can easily see the bigger picture. Then there’s the Relative Strength Index (RSI); it’s like a quick gauge showing if an asset is overbought or oversold. The MACD helps spot potential trend changes too. Bollinger Bands give you insight into volatility, while Fibonacci Retracement can highlight important support and resistance levels. Combining these signals with your own research will definitely strengthen your trading strategy. Want to learn more about technical analysis? Let’s get started!
Moving Averages (MA) - Simple vs. Exponential
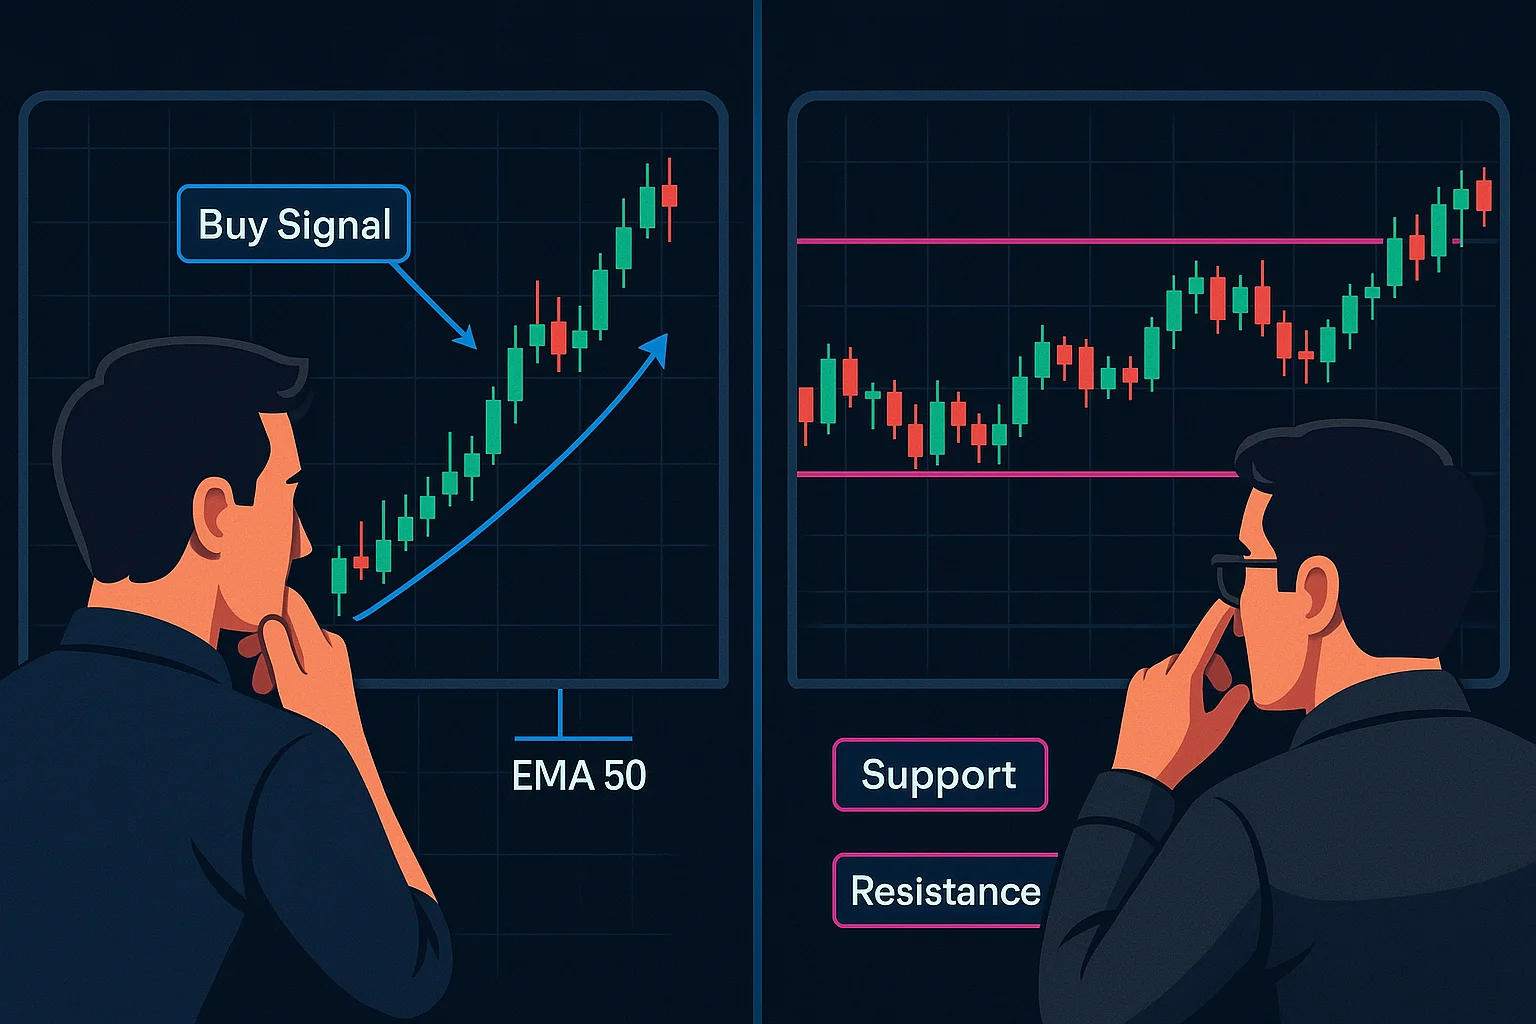
Simple Moving Averages (SMA) offer a straightforward way to average prices over time – it’s pretty basic, really! But Exponential Moving Averages (EMA) are different; they give more weight to recent prices, which is key in technical analysis. You’ll find EMAs react quicker than SMAs, potentially giving you earlier signals. Still, that sensitivity can occasionally lead to false alarms. Many traders use the SMA for spotting longer-term trends and EMA to check shorter-term momentum.
Relative Strength Index (RSI)
The RSI, or Relative Strength Index, is a really useful tool for technical analysis. It’s like having a gauge that tells you if an asset’s price has jumped too far, too quickly! Generally, readings above 70 might indicate it’s overbought, and values below 30 could suggest it’s oversold – perhaps signaling a potential reversal is on the horizon.
MACD (Moving Average Convergence Divergence)
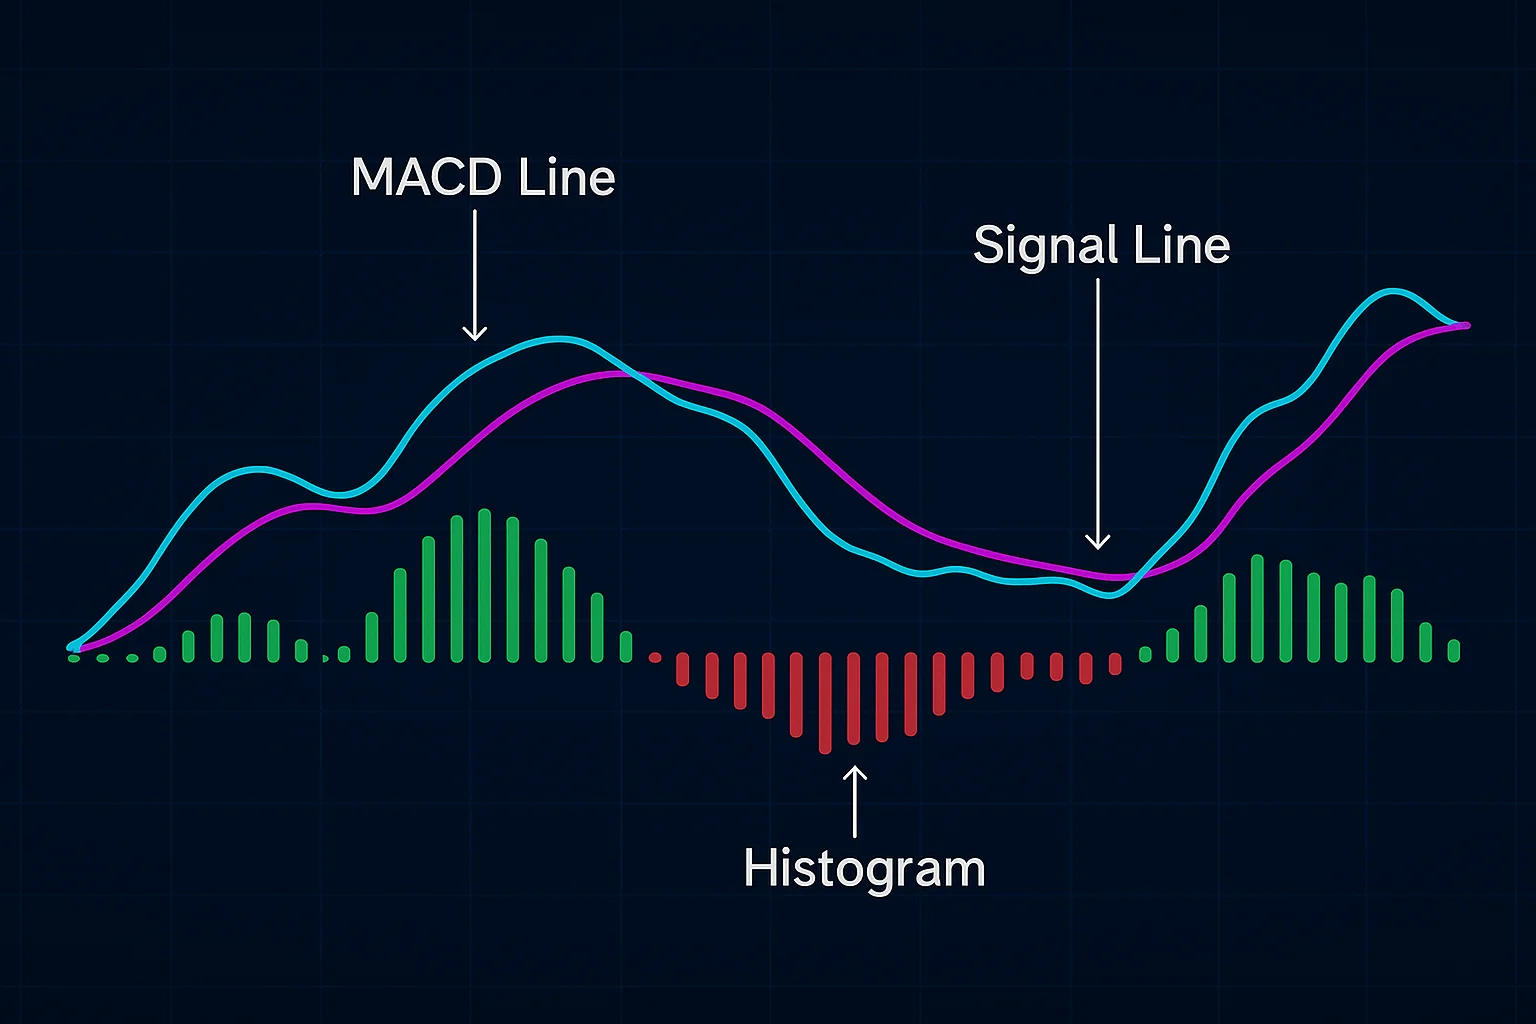
The MACD (Moving Average Convergence Divergence) is a popular tool for technical analysts – it essentially tracks momentum by illustrating the connection between two exponential moving averages. Many traders find it helpful in identifying potential trend reversals and assessing overall strength. The histogram offers a visual cue, highlighting those shifts in momentum; that’s really valuable within technical analysis. Keep an eye out for crossovers and divergences—they can often signal good times to buy or sell.
Pros & Cons of Technical Analysis
Many investors rely on technical analysis to evaluate securities – essentially, examining past price and volume data to identify potential trading opportunities. It’s really powerful for spotting recognizable patterns that can help traders react swiftly to shifts in the market, and thankfully, it’s not overly complicated to learn, making it adaptable across various markets.
Of course, technical analysis has its downsides too. For instance, it doesn’t consider a company’s underlying financial health. A key challenge is the possibility of false signals – past performance isn’t always an indicator of what’s to come! Unexpected news or market noise can easily throw established patterns off track. Successful use requires discipline and can be quite time-intensive, plus interpreting those signals often involves a bit of personal judgment.
Advantages of Using TA
Technical Analysis (TA) offers a real advantage to traders looking for an edge in the market. It’s all about using past price action and familiar patterns—think of it as a visual look at how people feel about the market right now. With objective analysis through charts and indicators, you can often avoid those impulsive, emotion-driven trades.
What’s more, TA lets you adapt quickly to changing conditions. Identifying trends and key support/resistance levels helps refine your strategies efficiently. While interpretations might differ sometimes, the core principles of technical analysis tend to hold up pretty well across various investments.
Objective and Data-Driven
A data-driven trading approach really boils down to clear thinking and measurable outcomes – it’s like having a reliable map instead of wandering aimlessly! Relying solely on intuition can be risky; instead, consider historical data and statistical models for more informed decisions. This helps keep emotions in check and increases the likelihood of consistent success.
Keeping an eye on key performance indicators is essential. Technical analysis tools and research provide valuable insights too. By regularly evaluating trades based on objective evidence, traders can refine their strategies and boost profitability.
Readily Available Historical Data
Understanding historical data is key to crafting winning trading strategies – it’s the bedrock! Thankfully, most brokers and financial sites offer a wealth of price records, showing everything from daily shifts to long-term trends. This makes it possible for traders like you to thoroughly backtest ideas and refine models using real market performance.
Backtesting is absolutely vital; analyzing historical data helps spot potential strengths and weaknesses before putting any money at risk. Ultimately, utilizing this resource empowers more informed decisions within technical analysis.
Suitable for Short-Term Trading
Short-term trading—especially day trading—can be incredibly rewarding when volatility picks up and markets are flowing smoothly. Think of strategies like scalping and momentum trading as catching quick waves in the market! Futures contracts and rapidly changing stocks present fantastic opportunities to jump in and out. Really honing your technical analysis skills is key; spotting those patterns can make all the difference. And remember, focus on the immediate action while always protecting yourself with stop-loss orders.
Disadvantages of Using TA
Technical analysis offers valuable insights, doesn’t it? However, relying solely on chart patterns can be a bit of a gamble. Market shifts happen, and those clues sometimes lead us astray! It’s easy to jump into trades too quickly. Beyond the charts, remember that things like economic news and a company’s financial standing really influence what an asset is worth. Plus, past performance isn’t always a predictor of future success. To learn more about this approach, check out https://www.investopedia.com/terms/t/technicalanalysis.asp. Ultimately, blending technical and fundamental research can strengthen your trading strategy.
Subjectivity in Interpretation
Technical analysis—reading charts and spotting patterns—isn’t as cut-and-dried as it seems. There’s a good deal of subjectivity in interpretation, you see! A trader’s past experiences and personal biases heavily influence how they perceive signals; what looks bullish to one person might appear neutral to another. Being aware of this variability is really important for consistent trading success, and understanding potential biases—like confirmation bias—can help lead to more balanced choices. Investopedia – Cognitive Bias
Lagging Indicators Can Provide Delayed Signals
Lagging indicators, such as closing prices and moving averages, reflect what’s already occurred in the market – think of them as looking back. They aren’t perfect predictors, but these signals can confirm existing trends, helping traders assess their strength and identify important support or resistance levels. For example, increasing volume alongside rising closing prices often reinforces an uptrend. While delayed, this confirmation can still inform your trading decisions; remember to combine lagging indicators with other analysis methods for a well-rounded approach. https://www.investopedia.com/terms/l/laggingindicator.asp
Doesn't Account for External Factors
Technical analysis is really helpful for noticing trends in price charts, though it often overlooks what’s happening outside the market. That’s because it mainly focuses on past data – a useful simplification that makes things easier to grasp. It works well most of the time, but keep in mind external factors can still play a big role.
What is Fundamental Analysis?
Understanding a company’s true worth is at the heart of fundamental analysis, a vital investment strategy. It’s about digging deeper than just looking at stock charts – something technical analysis focuses on. Instead, you examine what really makes a business tick: things like its financial health (checking out those balance sheets and income statements), assessing how well it’s led, and keeping an eye on the broader economy and changes within its industry.
Ultimately, fundamental analysis helps determine if a stock’s price accurately reflects its intrinsic value – are we overpaying or getting a good deal? Many investors believe that markets can misprice things temporarily, but eventually, prices tend to adjust.
Core Principles of Fundamental Analysis
Fundamental analysis offers investors a way to gauge a company’s real value, going beyond surface-level metrics. It’s all about examining its financial health and future prospects – things like financial statements, profitability, and debt levels. Essentially, you’re doing some serious digging! Don’t forget the industry landscape and how it stacks up against competitors; that’s key to a solid valuation.
Economic Indicators & Macro Trends
Grasping economic indicators can really help you understand what’s happening with currencies. For example, GDP growth gives us a sense of how well an economy is doing, and inflation shows us how much your money buys. Plus, unemployment numbers tell us about the job market – all crucial when looking at exchange rates. Things like interest rate changes and shifts in global trade also have a big impact on currency valuation.
Company Financial Statements (Balance Sheet, Income Statement, Cash Flow)
Grasping company financial statements is really important when you want to understand a business’s overall health. Think of the Balance Sheet as a quick picture – it shows what a company owns, what it owes, and what belongs to its owners at a specific point in time. Then there’s the Income Statement, often called the Profit & Loss report; this details revenues and expenses, giving you an idea of profitability over a period. Lastly, the Cash Flow Statement highlights how cash is coming into and going out of the business, which investors find helpful for assessing liquidity.
Key Metrics to Analyze
Tracking your trades involves looking at key figures – it’s more than just profit or loss (P&L)! Your win rate and average trade duration are also important. Don’t forget drawdown, the largest drop in your account; keeping an eye on that is crucial for managing risk effectively. These initial insights offer a solid foundation for evaluating your strategy.
Beyond the basics, metrics like the Sharpe Ratio (which balances return and risk) and maximum consecutive losses provide even more detail. Regularly reviewing these can reveal valuable trends, allowing you to refine your approach and ultimately improve your trading outcomes. Ready to dive into technical analysis? Let’s get started!
Earnings Per Share (EPS)
Earnings Per Share (EPS) is a key metric showing how much profit a company generates for each outstanding share – essentially dividing the total earnings among shareholders. Investors often use EPS to quickly gauge profitability and compare different investment options. There are two main types: basic EPS, which considers only common stock, and diluted EPS, providing a more conservative view by accounting for potential future shares.
Price-to-Earnings Ratio (P/E)
The Price-to-Earnings Ratio (P/E) is a widely used tool for quickly assessing stock value – essentially, it reveals how much investors are willing to pay for each dollar of a company’s earnings. It can offer clues about whether a stock might be over or undervalued. However, keep in mind that P/E ratios don’t paint the complete picture; things like debt and anticipated growth play a role too! Comparing them to industry averages is helpful, though high-growth companies frequently have higher ratios.
Debt-to-Equity Ratio
Understanding a company’s financial health? The debt-to-equity ratio is a helpful tool! It reveals how much a business relies on borrowing compared to shareholder investments. Generally, a higher number might indicate greater risk, whereas a lower one often points toward stability and less loan dependence—something investors and creditors find incredibly valuable.
Pros & Cons of Fundamental Analysis
Fundamental analysis is a widely used investment strategy focused on uncovering a company’s true value. By carefully examining its financial standing and the surrounding economic landscape, investors can often identify undervalued assets – potentially leading to rewarding long-term gains. It provides a more complete picture of a business than technical analysis alone, considering things like effective leadership and competitive positioning within its industry; it’s about seeing the whole story, not just the trends on a chart.
Naturally, there are hurdles. Market sentiment can sometimes temporarily cloud a company’s actual worth, making accurate predictions difficult. And interpreting financial data isn’t always simple – different analysts might reach varying conclusions. Plus, it can be tough to foresee those unexpected events, those black swan moments that can really disrupt the market.
Advantages of Using FA
Fibonacci Analysis offers a unique perspective on potential support and resistance – it’s a really interesting part of technical analysis. You might be surprised how accurately Fibonacci ratios can predict price movements, helping you find those sweet spots for entering and exiting trades to boost profits while keeping risk in check. It’s quite versatile too; this tool works well across various markets and timeframes, fitting nicely with other strategies and giving valuable insights into what’s driving market behavior.
Long-Term Perspective and Value Investing
Value investing really encourages a long-term perspective, doesn’t it? It’s all about spotting those companies the market might have temporarily overlooked – kind of like finding a hidden gem! Rather than chasing quick trades, this strategy focuses on fundamental analysis to truly understand a company’s worth. Patience is key; staying calm and making informed decisions will serve you well.
Identifies Undervalued Assets
Smart investing often hinges on uncovering undervalued assets – and that’s where fundamental analysis comes in handy! It’s like being a treasure hunter, looking for those moments when the market misses the mark on a company’s real value. By digging into financial details and keeping an eye on broader economic trends, you can potentially find mispricings. Sometimes, temporary setbacks or negative headlines create these opportunities – allowing savvy investors to snag assets trading below their actual worth.
Provides a Deeper Understanding of Business Health
Really understanding a business’s health involves more than just looking at the numbers – though those are important! Things like how loyal customers are, and even employee satisfaction, paint a fuller picture of what’s going on. Spotting these signals can reveal both strengths and areas needing attention for future growth.
It’s also crucial to think about less obvious factors too. Keeping an eye on market changes, the competition, and your brand’s reputation offers valuable insights. Combining this qualitative assessment with data helps ensure you’re making smart decisions.
Disadvantages of Using FA
Time-Consuming Research Required
Truly successful trading really does depend on solid market research – it’s a significant time investment, that’s for sure! Don’t just give charts a quick look; plan on spending hours digging into financial details and spotting those key industry trends. This deep dive informs important decisions, particularly when you’re doing fundamental analysis. Skipping this careful review can lead to mistakes, so prioritize diligent research for the best results.
Requires Financial Literacy and Expertise
Becoming a successful trader isn’t just about instinct – it requires real financial know-how and honed skills. Understanding core concepts like risk management, asset valuation, and market dynamics is absolutely vital. Without this foundation, traders can easily face losses or miss out on opportunities when navigating complex trading strategies.
Can Be Less Effective in Fast-Moving Markets
Trend following strategies are often a cornerstone of technical analysis, and generally perform quite well. However, these approaches can sometimes falter when markets shift quickly – it’s similar to trying to snag a speeding ball; that slight delay in reacting could mean missing crucial developments, particularly during quieter periods.
Technical vs. Fundamental: A Comparison Table
For anyone stepping into the world of trading, grasping the difference between technical analysis and fundamental analysis is really important. It’s a helpful distinction! Imagine technical analysis as looking at price charts and trading volume – essentially focusing on what has already occurred in the market to identify patterns and potentially predict what comes next. Conversely, fundamental analysis takes a broader view, digging into a company’s financial health and considering wider economic factors to gauge its true worth; it’s all about understanding why those movements are happening.
The core difference really lies in where traders source their insights. Technical analysts pore over historical price data, while fundamentalists examine things like financial statements, industry trends, and the overall economy. You’ll often find that technical analysis is favored for shorter-term trades, whereas fundamental analysis tends to inform longer-term investment decisions.
Methodology Differences
There’s a fascinating range of trading methodologies out there, each offering a unique perspective. Think of technical analysis as looking at price charts – kind of like predicting weather based on past patterns! It’s all about spotting those signals in historical data to anticipate what might happen next. Then you have fundamental analysis, which takes a broader view, considering things like the economy and company finances to determine true value.
Some traders focus on trend following, hoping to ride consistent market movements, while others believe prices eventually revert to their average – that’s mean reversion. Ultimately, the “best” approach really comes down to your personal risk tolerance and how you see the markets working.
Timeframe Suitability (Short-Term vs. Long-Term)
Choosing the right timeframe suitability can really make or break your trading success! Quick strategies like day trading and swing trading frequently lean on technical analysis – things like moving averages and RSI help spot opportunities in those rapid price changes you see over hours or days. Conversely, long-term investors often look at the bigger picture with fundamental analysis, considering company financials and industry trends. A consistent buy-and-hold approach really shines when you’re thinking long term, helping to smooth out those daily market bumps.
Data Sources & Information Used
We’ve put together an analysis that combines what’s happening right now with longer-term trends. For accurate market prices and trading volume, we rely on solid sources like Refinitiv and Bloomberg, alongside economic data from the Federal Reserve and BEA. Naturally, data integrity is a top priority – every feed gets thoroughly checked. To get a feel for market sentiment, we also look at financial news, adding a wider perspective to our technical analysis.
Risk Tolerance Alignment
Figuring out your risk tolerance is a really important first step in investing – think of it like finding the perfect pair of shoes! It’s all about choosing investments that feel comfortable given how you handle potential losses. Things like your age, income, and what you’re hoping to achieve financially definitely influence this. A personalized approach can build confidence and help you stay on track, even when the market gets a little wild. Ready to explore creating an investment plan designed just for you? Check out our resources!
Choosing the Right Approach for You
Finding the right trading approach is really important if you want to see success – it all begins with understanding yourself! Take a moment to consider your personality; do you tend to jump into things, or are you more of an analyzer? Your risk tolerance plays a big role too – how much potential loss feels comfortable? And let’s not forget about time commitments. Day trading demands constant attention, while long-term investing allows for a more relaxed pace.
There’s quite a few options out there, like day trading, swing trading, and long-term investing. Think of day traders as catching quick waves, swing traders riding longer swells, and long-term investors building a solid foundation. Figuring out these differences – and aligning them with your own style – is key to making smart decisions when you trade.
Short-Term Trading Strategies (Day Trading, Swing Trading) - TA Focus
Thinking about short-term trading? Whether it’s the fast pace of day trading or the slightly longer timeframe of swing trading, technical analysis plays a huge role. Day traders are constantly watching price movements – they rely on charts and indicators to make those quick decisions! Swing traders, on the other hand, might hold positions for days or even weeks, searching for trends in TA patterns that could lead to bigger gains. Tools like moving averages and the relative strength index (RSI) can be helpful regardless of your approach. Day trading demands constant focus, but swing trading offers more breathing room – either way, a solid grasp of technical analysis is essential.
Long-Term Investing Strategies (Value Investing, Growth Investing) - FA Focus
Financial advisors often rely on long-term investing strategies to build dependable client portfolios—it’s about thinking ahead! Consider value investing; it’s like spotting those overlooked gems – companies with solid potential currently priced low, anticipating a market turnaround. Alternatively, growth investing focuses on businesses experiencing rapid expansion and boosting profits, aiming for substantial gains down the road.
Combining Technical and Fundamental Analysis
Blending technical analysis with fundamental analysis can really strengthen your approach to trading. Consider fundamental analysis like getting the full picture – checking out a company’s financial health, for example. Then, technical analysis uses charts to help you identify good times to buy or sell. When these two work together, it’s powerful! Think of a company announcing fantastic earnings and showing a positive trend on its chart—that’s a strong signal. They complement each other beautifully. Ready to learn more? Check out our resources and take your trading to the next level!
The Importance of a Trading Journal
Want to level up your trading game? A trading journal might be just what you need! It’s way more than simply noting down your trades; consider it a detailed record of everything – entry and exit points, the logic behind your choices, even how you were feeling at the time. Ultimately, this creates a valuable roadmap for spotting both where you excel and areas needing improvement, helping you fine-tune your trading strategies.
It’s really important to dig into why you made those decisions. For example, do certain market conditions consistently work well (or not so well) for your approach? Do emotions sometimes cloud your judgment? You can find even more helpful advice and insights at resources like https://flows.trading/benefits-of-keeping-a-trading-journal/. Consistent, thoughtful journaling is truly a cornerstone of long-term success.
Tracking Trades & Performance Metrics
Evaluating trading effectiveness really hinges on tracking trades and key performance metrics – it’s how you move beyond guesswork! Accurate record-keeping is truly the foundation of a solid plan. Keep an eye on things like your win rate, profit factor, average trade time, and maximum drawdown; analyzing these gives you valuable insights into both risk and potential gains. Regularly reviewing these figures lets you make smart adjustments to optimize your technical analysis approach.
Identifying Strengths and Weaknesses
Understanding your strengths and weaknesses is vital for consistent trading success, wouldn’t you agree? A little self-reflection can reveal what’s working well – perhaps a knack for spotting chart patterns – while also highlighting areas where you could improve, like risk management. Being honest with yourself, without bias, really unlocks targeted growth.
Consider this: do you consistently profit from technical analysis but find news events tricky? Then focus on fundamental research. Or maybe company financials are your forte, but pattern recognition isn’t? Prioritizing those technical skills could make a big difference.
Utilizing Tools Like Flows.trading for Enhanced Analysis
Technical analysis doesn’t have to be a grind! Platforms like Flows.trading really change the game, letting you automate those repetitive tasks—things like spotting chart patterns or applying indicators. Think about it: more time focusing on interpreting signals and developing winning strategies. It’s a huge boost for both speed and accuracy in your decisions.
Flows.trading also makes backtesting and scenario planning surprisingly simple, so you can get a better feel for how trades might play out. Ultimately, using its features helps sharpen your technical analysis skills and improve your trading performance overall. Want to level up your analytical process? Check out Flows.trading today!
Conclusion: Your Path to Informed Trading
Becoming a successful trader really comes down to understanding technical analysis and having a good handle on fundamental principles. You could think of technical analysis as similar to reading weather patterns – it uses price charts and trends to try and predict what the market might do next. On the other hand, fundamental analysis is more like checking up on how healthy an economy or a company really is. Both offer valuable insights, but the real magic happens when you blend them together into a strategy that feels right for you and your goals.
To keep improving, it’s a great idea to practice with paper trading accounts and regularly look over market data. Plus, exploring financial news and dedicated trading platforms can really boost your knowledge. Remember, continuous learning is essential – making informed decisions is what sets the stage for greater success in this dynamic world of trading!
Recap of Key Differences Between TA and FA
Technical analysis (TA) and fundamental analysis (FA) provide distinct approaches to evaluating investments. Think of TA as examining price charts and trading volume—it’s really about understanding market psychology and spotting patterns from past trends. Meanwhile, fundamental analysis takes a deeper dive, scrutinizing a company’s financials, its industry landscape, and the broader economy to assess its true value. Ultimately, it helps you decide if something is undervalued or overvalued – crucial for informed trading decisions.
Encouragement to Experiment with Both Approaches
So, let’s dive into technical analysis – a really hands-on process! I suggest experimenting with moving averages and the Relative Strength Index (RSI). It’s kind of like finding the perfect tool; what clicks for one trader might not work as well for you. Remember, learning is key here, so don’t stress about immediate profits. Instead, focus on backtesting and paper trading to see which strategies – or even combinations – really fit your style and comfort level with risk.
Continuous Learning and Adaptation in the Markets
Markets are always in flux – change is simply a constant! Smart traders understand this, so they prioritize continuous learning to stay ahead of the curve. Adapting your strategies to things like economic shifts or emerging technologies is really important for long-term success; ignoring these changes can definitely lead to losses. To thrive, regularly revisit your approach by exploring new data sources and different analytical techniques. Embrace ongoing improvement – it’s truly key to navigating market volatility and achieving lasting gains. Ready to level up? Start learning today!