All-in-One Trading Signal Dashboard: Personalized Insights for Every Strategy
Track performance. Filter strategies. Act with precision.
What Is It? – Feature Overview
Your Trading Companion, Reimagined
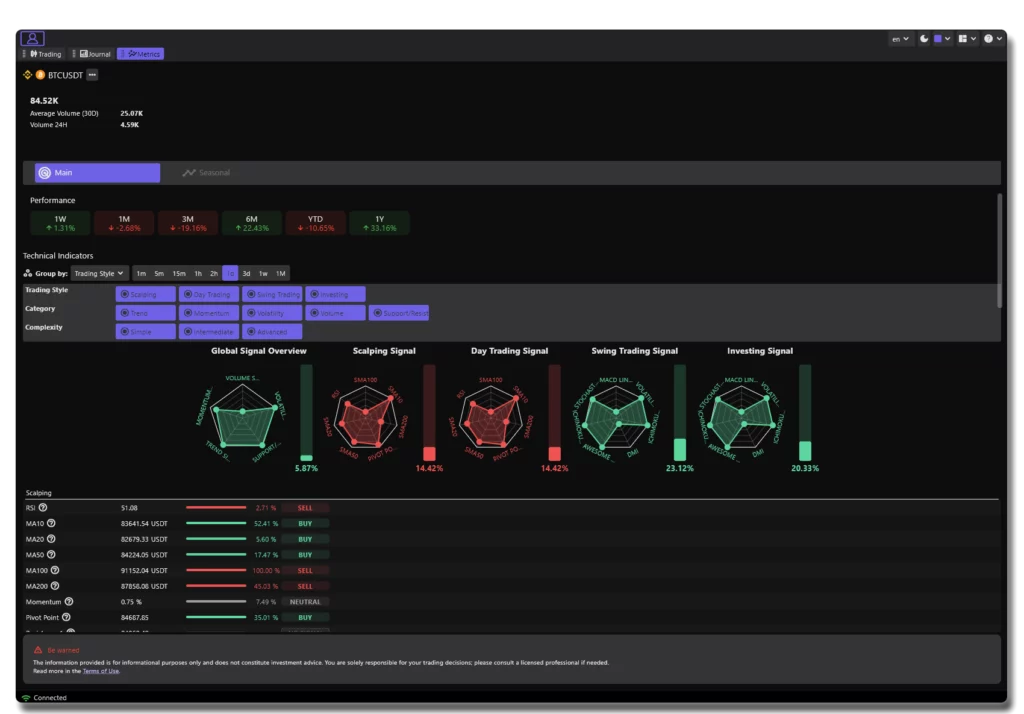
Our Smart Technical Signal Dashboard is designed to give traders a fast, visual, and intelligent way to interpret the markets. Whether you’re into scalping, day trading, swing trading, or long-term investing, this feature helps you instantly assess the strength of each strategy using real-time data and technical indicators.
From classic tools like RSI, moving averages, and momentum indicators, to complex signal synthesis and multi-timeframe analysis — everything is aggregated and translated into clear, actionable signals.
Thanks to our strategy-based filters, you can focus only on the indicators that match your style, timeframe, and complexity level. No more noise. Just the data that matters — beautifully visualized and easy to understand.
This is not just another indicators panel. It’s a full-featured trading signal engine designed to help you analyze faster, decide smarter, and trade more confidently.
Metrics tell the story. Signals show the turning point. Great traders listen to both.
Key Benefits
Custom Signal Overview
Instantly visualize buy/sell signals across all major trading styles: scalping, day trading, swing and long-term investing.
Real-Time Signal Strength
Style-Based Filtering
Custom Signal Overview
Performance Tracking
Technical Indicator Breakdown
Deep Dive into Your Trading Signals
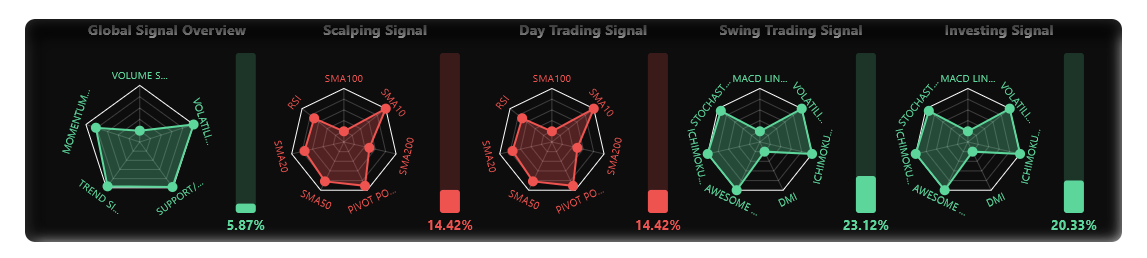
Go beyond the basics with a detailed breakdown of every technical signal.
Each strategy — scalping, day trading, swing, or investing — comes with its own radar chart, highlighting the strength of key indicators like RSI, Moving Averages, MACD, Pivot Points, and more.
Quickly spot bullish or bearish setups with clear visual cues and signal percentages.
Explore how each indicator contributes to the overall signal strength and adjust your tactics accordingly.
Perfect for traders who want full transparency, fast decision-making, and powerful visual feedback — all in one place.
Trading Signals & Metrics Dashboard
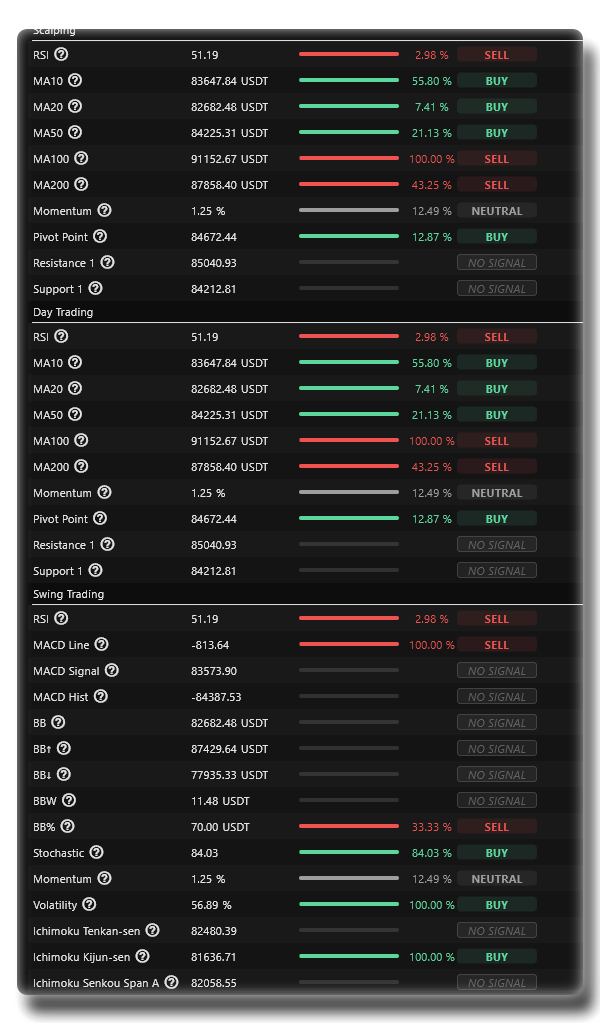
Stay ahead of the market with our powerful analytics suite. Our platform delivers trading signals across scalping, day trading, and swing trading strategies. Instantly access key indicators like RSI, MACD, moving averages, momentum, Bollinger Bands, and Ichimoku Cloud — all consolidated into a single, intuitive dashboard.
Whether you’re looking for short-term opportunities or long-term positioning, our signal system helps you make informed decisions based on dynamic market data. Each metric is clearly labeled with actionable insights — BUY, SELL, or NEUTRAL — so you can react with confidence.
Empower your trading with data that speaks your language.
Designed for All Trader Profiles
Whether you’re just starting out or managing multi-asset portfolios, our Trading Signal Dashboard adapts to your experience, goals, and workflow.
From simplified overviews for beginners to in-depth signal analysis for strategy developers, this feature gives every trader the insights they need — faster, clearer, smarter.
Beginners – Learn by Seeing
Get a clear visual introduction to technical indicators and trading signals without the noise. Understand the basics of RSI, MACD, trends, and market sentiment through simplified dashboards and clean signal scores.
It’s the perfect launchpad for new traders.
Active Traders – Speed and Clarity in Every Signal
Stay one step ahead with real-time signals built for fast execution. Filter by strategy, timeframe, or instrument type to instantly find high-probability setups and capitalize on short-term market moves.
Ideal for day traders and scalpers.
Strategy Learners – Decode Every Move
Explore how signals are built, what indicators matter, and why they trigger. Perfect for traders who want to go deeper, test new ideas, and improve their decision-making with actionable, transparent data.
Portfolio Managers – Smart Oversight at Scale
Get a panoramic view of market conditions and technical trends across multiple instruments.
Monitor long-term performance and macro indicators at a glance, so you can rebalance, hedge, and invest with precision.
Add Your Heading Text Here
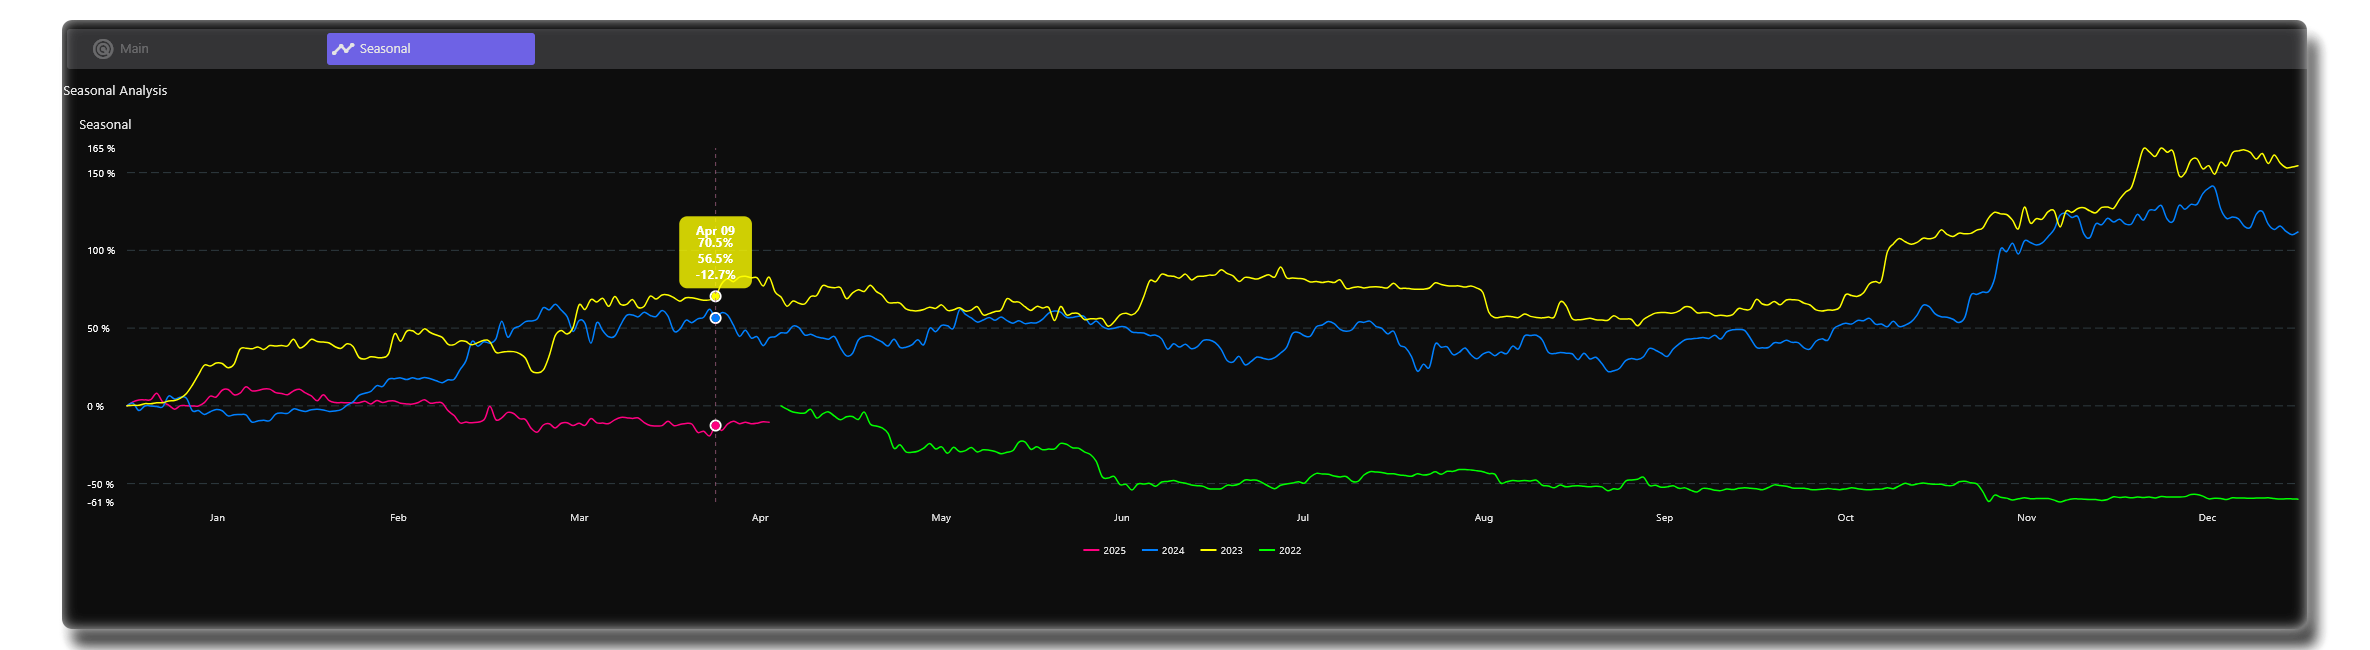
Understand the rhythm of the markets with our Seasonality Analysis tool. This feature highlights how assets typically perform at different times of the year, based on historical data. Whether you’re analyzing trends from 2022, 2023, or the current year, our seasonal chart helps you spot recurring patterns, anomalies, and optimal entry or exit windows.
Leverage this powerful visualization to align your strategies with proven market behaviors. Perfect for swing traders and position traders, our seasonality view gives you a data-backed edge — turning historical performance into forward-looking insights.
- Compare multiple years
- Identify bullish and bearish seasonal windows
- Optimize timing for your trades with precision
Stay one step ahead — trade with the seasons, not against them.
faqEverything you need
to know about
The Signal Dashboard helps you quickly identify buy and sell opportunities based on real-time technical analysis. It centralizes key indicators and shows signal strength across different trading styles.
Not at all. The dashboard is beginner-friendly with intuitive visuals, simplified signals, and tooltips that explain each metric. It’s a great starting point for anyone learning technical analysis.
The dashboard includes dedicated views for scalping, day trading, swing trading, and investing — each optimized with relevant indicators and timeframes.
Each signal is based on a combination of technical indicators like RSI, MACD, Moving Averages, Bollinger Bands, and more. The system synthesizes these into a score that reflects the strength and direction of the signal.
Yes. You can filter signals by trading style, complexity level, indicator category. It lets you focus only on what’s relevant to your personal strategy.
The signals are based on real-time technical indicators designed to support your market analysis — not to replace your judgment. They are tools, not investment advice. Every trader remains fully responsible for their own decisions, risk management, and strategy execution. If you’re unsure, we strongly recommend consulting a licensed financial advisor before making any investment decisions.