The Main Signal Dashboard is the core of the Trading Signals feature.
Its goal is simple: help you understand what the market is doing right now, from multiple perspectives, in seconds.
This page explains:
What the Main dashboard shows
How to configure it
How to read each part
In which context it’s most useful
How different traders can use it
What the Main Dashboard Is #
The Main dashboard is a real-time technical analysis assistant.
It groups dozens of indicators into a single view and organizes them according to:
-
Trading Style
Scalping – Day Trading – Swing Trading – Investing -
Category
Trend – Momentum – Volume – Volatility – Support/Resistance -
Complexity
Simple – Intermediate – Advanced
You get a complete and structured overview of the technical health of the asset, without having to study every indicator manually.
Instead of “What does the RSI say? What does the MACD say? What about moving averages?”, you get:
A combined interpretation of all of them, tuned to your trading style.
Configuring Your Signal View #
At the top of the panel, you can adjust four essential settings:
1. Group By #
This changes how indicators are visually organized.
You can group them by:
-
Trading Style
-
Category
-
Complexity
-
Timeframe
This lets you switch between:
-
A trader-style view (“What’s best for scalping right now?”)
-
A technical view (“Show me all momentum indicators together”)
-
A skill-level view (“Show only simple indicators”)
2. Trading Style Filters #
You can toggle:
-
Scalping
-
Day Trading
-
Swing Trading
-
Investing
Each style uses a different set of indicators and weightings.
For example:
-
Scalping focuses on speed, volatility and ultra-short-term direction.
-
Investing cares about long-term trend stability and macro strength.
3. Category Filters #
To focus your analysis on what matters most:
-
Trend indicators
-
Momentum indicators
-
Volume indicators
-
Volatility indicators
-
Support/Resistance
This is useful if you want to answer a specific question like:
-
“Is the trend strong enough?”
-
“Is volume confirming this move?”
-
“Is momentum aligned with direction?”
4. Complexity Filters #
Choose the type of indicators you prefer:
-
Simple (SMA, RSI, etc.)
-
Intermediate (MACD, DMI…)
-
Advanced (Ichimoku, Parabolic SAR…)
This is perfect for beginners who want a clean, simple view—or experts who want full detail.
How to Read the Dashboard #
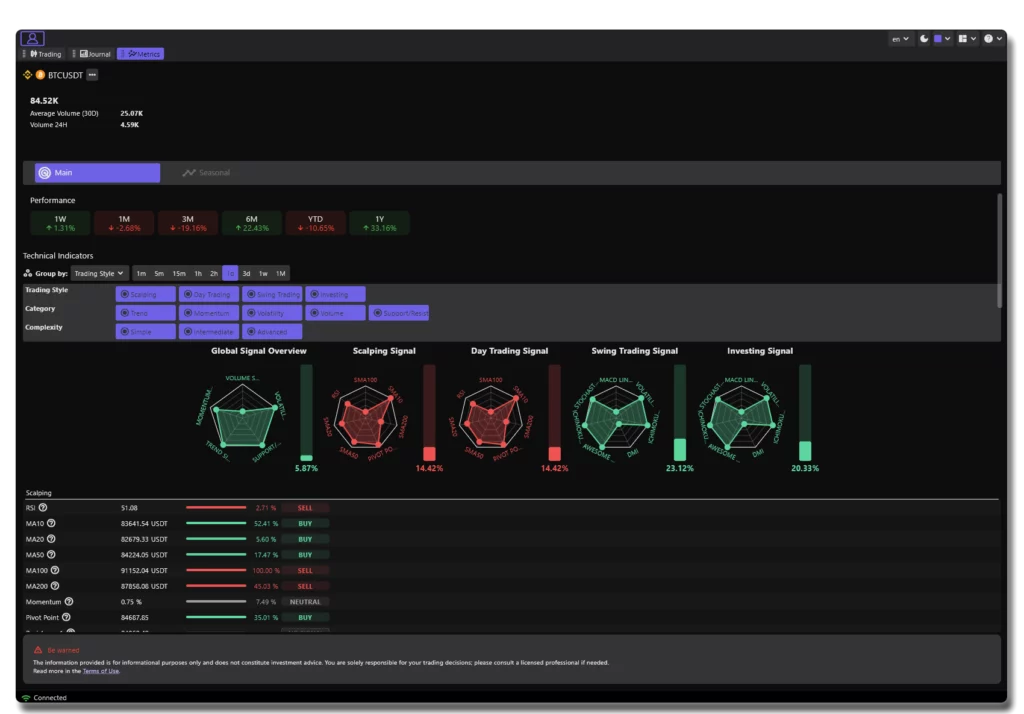
The dashboard is divided into several functional areas.
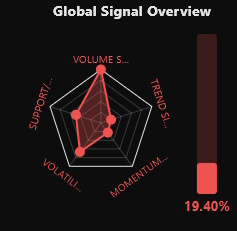
1. Global Signal Overview #
A radar/spider chart showing the combined strength of:
Trend
Momentum
Volume
Volatility
Support/Resistance
The center = weaker signal.
The outer edge = stronger signal.

This allows you to instantly gauge:
Whether the asset is trending or ranging
Whether momentum is building
Whether volume is confirming moves
Whether volatility is supportive or chaotic
A strong and balanced shape means strong alignment.
A deformed or mixed shape means a choppy or uncertain market.
2. Style-Specific Signals #
Each trading style gets its own signal card:
Scalping Signal
Day Trading Signal
Swing Trading Signal
Investing Signal

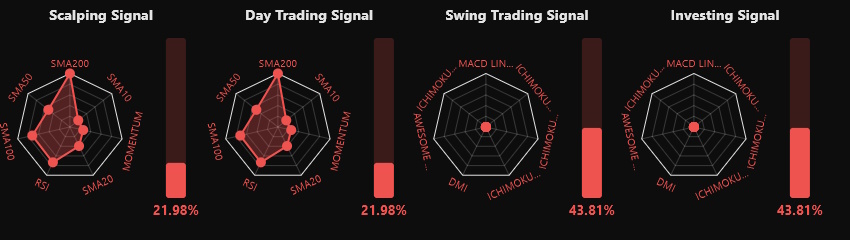
Each signal represents the combined result of the indicators used for that style.
The percentage bar on the right shows:
The strength of the signal
How bullish or bearish the setup is
This helps you quickly answer:
“Is today a good environment for this trading style?”
3. Indicator Table #
Below the signals, you will find the detailed indicator list, showing:
Indicator value
Signal direction (Buy/Sell)
Strength (%)
Group (trend, momentum…)

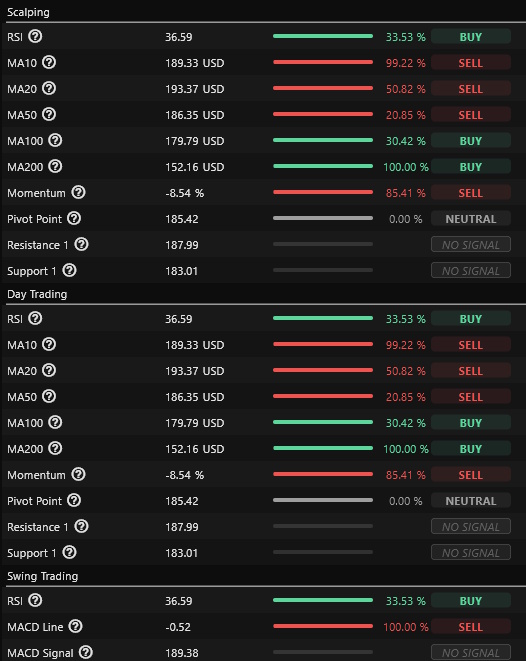
This gives transparency and lets you understand exactly why the signal has a certain score.
You can see:
Which indicators agree
Which indicators disagree
Whether the signal is driven by trend, momentum, or volume
How to Use the Main Dashboard Effectively #
1. Preparing a Trade #
Before entering:
-
Check your trading style’s signal
-
Confirm trend or momentum strength
-
Verify that indicators are aligned
-
Evaluate volume confirmation
If signals disagree or alignment is weak, you may want to wait for better conditions.
2. Validating Your Bias #
If you have a trading idea (“I think this will go up”), use the signals to confirm or challenge it.
Example:
-
Trend strong
-
Momentum rising
-
Volume supportive
→ The setup is solid.
Or:
-
Trend strong
-
Momentum falling
-
Volatility increasing
→ Be cautious; conditions may turn.
3. Monitoring an Active Trade #
When you’re in a position:
-
Check if your signal stays aligned
-
Watch for momentum weakness
-
Track volume drying up
-
Anticipate reversals
This helps you manage exits with more discipline.
Which Type of Trader Should Focus on What? #
Scalpers #
→ Watch momentum + volatility.
→ Focus on 1m, 5m timeframes.
→ Look for synchronization across short-term indicators.
Day Traders #
→ Monitor trend + momentum.
→ Use intraday timeframes (15m–2h).
→ Confirm with volume.
Swing Traders #
→ Focus on trend alignment + support/resistance.
→ Use multi-day signals (1d–1w).
→ Look for stable setups, not fast spikes.
Investors #
→ Look at long-term trend + global signal shape.
→ Ignore intraday noise.
→ Seek alignment across higher timeframes.
Summary #
The Main Trading Signal Dashboard helps you:
-
Understand the market instantly
-
Configure signals to match your trading style
-
Analyze trends, momentum, volume, volatility together
-
Make better, faster, more confident decisions
-
Validate or challenge your trade ideas
-
Build discipline in your strategy
It’s a powerful, flexible, and intuitive tool built for traders of all experience levels.