Indicators are one of the most widely used tools in trading.
At their core, indicators are mathematical transformations of price, volume, or volatility. They take raw market data and express it in a way that makes patterns easier to see:
-
Trends become smoother
-
Momentum becomes measurable
-
Volatility becomes visible
-
Market structure becomes quantifiable
This ability to transform complexity into something readable is why indicators remain essential in modern trading.
But it’s important to understand what indicators do — and what they don’t do.
Indicators do not predict the future.
What they do is reveal information the naked eye struggles to detect: acceleration in price, underlying weakness, trend exhaustion, structural shifts, volatility expansion, liquidity changes, and more.
Used correctly, they are an extension of your analysis, helping you confirm hypotheses, filter setups, or time decisions more accurately.
Used incorrectly, they become noisy or misleading.
Flows.Trading is built to help you use indicators intentionally, not just visually.
Why Traders Use Indicators #
1. To structure their decision-making #
Indicators turn subjective impressions (“it feels bullish”) into objective data (“momentum is increasing”, “volatility is compressing”).
2. To complement price action #
Indicators are not a replacement for technical analysis — they reinforce it.
Price action shows where the market is likely to move.
Indicators help refine when and how to engage.
3. To filter low-quality setups #
A market may look ready to move, but an indicator can reveal:
-
weak momentum,
-
lack of trend alignment,
-
fading volatility.
This prevents overtrading.
4. To standardize entries and exits #
A trend confirmation, a volatility breakout, or a momentum shift can become repeatable signals.
5. To measure what is otherwise invisible #
You cannot “see” divergence without comparing price and momentum.
You cannot “see” volatility contraction without a mathematical model.
Indicators bridge that gap.
How Indicators Fit Into a Complete Trading Strategy #
A strong strategy often uses indicators in one of these ways:
-
Trend indicators (EMA, SMA, WMA, SuperTrend)
→ Identify direction and bias. -
Momentum indicators (RSI, MACD)
→ Reveal strength, exhaustion, or divergence. -
Volatility indicators (Bollinger Bands, ATR)
→ Help time breakouts or define stop distances. -
Structure indicators (Pivots, Market Structure RSI)
→ Highlight key swing points or shifts. -
Volume-based indicators
→ Provide insight into participation and conviction.
And then…
price action ties everything together, turning indicator signals into actionable decisions.
Indicators in Flows.Trading #
Flows.Trading includes a curated set of the most widely used indicators in both retail and professional environments.
Each indicator is categorized, configurable, and can be customized extensively.
You also have the freedom to build your own indicators using a built-in editor based on standard JavaScript (more on this later).
Below is an example snapshot of indicator categories available:
Trend indicators #
-
EMA – Exponential Moving Average
-
SMA – Simple Moving Average
-
WMA – Weighted Moving Average
-
SuperTrend
Use case: Determine direction, bias, dynamic support/resistance.
Momentum indicators #
-
RSI – Relative Strength Index
-
MACD – Moving Average Convergence/Divergence
-
Choppiness Index
Use case: Identify exhaustion, divergence, shifts in strength.
Volatility indicators #
-
ATR – Average True Range
-
Bollinger Bands
-
Standard Deviation
Use case: Spot volatility expansions/compressions, size stops and targets.
Structure & pattern indicators #
-
Pivots
-
Market Structure RSI
Use case: Highlight swing points, structural shifts, or trend changes.
Volume & confirmation #
-
Volume Indicator (built-in)
Use case: Confirm moves with participation.
This list grows over time — and you can extend it infinitely through custom scripting.
Working With Indicators in Flows.Trading #
The indicators panel is designed to make selection, activation, and customization effortless.

1. Browsing and Filtering Indicators #
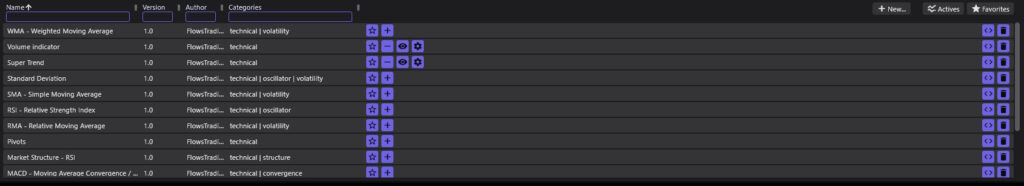
When you open the indicator list, you’ll see:
-
Categories (Trend, Momentum, Volatility, Structure…)
-
Name, Version, Author, Tags
-
Filters for favorites and active indicators
This helps you quickly find what you need depending on your strategy.
2. Adding an Indicator to the Current Chart #
To activate an indicator, simply click on this button ![]()
The indicator immediately appears on your chart, using its default configuration.
3. Favoriting Indicators #
Click the star icon to mark an indicator as a favorite.
This is helpful if you regularly use the same set of tools for your strategy.
4. Showing or Hiding Indicators #
Click the eye icon to toggle visibility:
-
Turn it off to declutter the chart temporarily
-
Turn it on to bring the analysis back
The indicator remains active but invisible.
5. Customizing Indicator Properties #
Every indicator includes visual and analytical settings:
-
Colors
-
Smoothing periods
-
Mathematical factors
-
Plot styles
-
Visibility and overlay rules
Click the settings icon to open the properties panel.
The panel automatically adapts to the indicator you selected, showing the specific parameters relevant to that indicator.
6. Viewing the Underlying Code #
Click the <> icon to inspect the indicator’s source code.
This is particularly useful for learning, debugging, or understanding how the logic works.
7. Creating Your Own Indicators #
Flows.Trading includes a full scripting environment.
Click the “New…” button to open the integrated editor.
A new indicator starts from a template written in JavaScript, augmented with trading-specific functions (covered in another documentation page).
With custom indicators, you can:
-
Encode your own strategies
-
Combine multiple inputs
-
Build proprietary signals
-
Reproduce indicators you see elsewhere
-
Create tools tailored to your workflow
Once saved, your custom indicator appears in the list like any other — with full support for favorites, visibility, and properties.
When and How to Use Indicators (Practical Guidance) #
To get value from indicators, apply them intentionally:
Use 1–3 core indicators per chart #
More indicators do not mean better analysis.
Choose tools that complement each other.
Let indicators confirm price action, not replace it #
Price comes first.
Indicators refine interpretation.
Use volatility indicators for risk management #
ATR and Bollinger Bands help you size positions logically.
Use momentum indicators for timing #
RSI, MACD, and Market Structure indicators help identify strong vs weak moments.
Use trend indicators for bias #
EMAs or SuperTrend clarify whether you should prefer longs or shorts.
Summary #
Indicators transform market data into readable signals.
They help traders understand trend, momentum, volatility, and structure — and they reinforce, rather than replace, price action analysis.
In Flows.Trading, indicators are:
-
Easy to browse and categorize
-
Simple to activate and configure
-
Fully customizable
-
Transparently coded
-
Extendable through a built-in JavaScript editor
Whether you rely on classic tools or want to develop your own models, Flows.Trading gives you the flexibility and structure to use indicators purposefully and consistently.