Build Your Own Trading Indicators: A Beginner’s Guide
Table of Contents
Understanding Trading Indicators: Foundations for Customization
Navigating the world of trading can feel overwhelming, right? But understanding trading indicators is a fantastic first step toward smarter market analysis. Think of them as helpful guides – they interpret past price movements to give you clues about what might happen next. These powerful tools are designed to spot patterns and generate signals that inform your decisions.
There’s a whole range of indicators out there! Trend-following indicators, like moving averages, show the general direction prices are heading. Momentum indicators (like RSI) tell you how quickly things are changing, while volatility measures – such as Bollinger Bands – reveal just how much price fluctuation to expect.
Before diving in, it’s really important to grasp how these established trading indicators function. Familiarize yourself with their calculations and typical signals; this foundational knowledge will empower you to critically evaluate existing tools and even design your own, perfectly tailored to your unique strategy and risk tolerance.
What are Trading Indicators and Why Use Them?
Ever feel like the market is shouting but you’re struggling to understand what it’s saying? That’s where trading indicators come in! These are essentially mathematical tools that sift through price and volume data, acting as filters to reveal potential trends. They can be really helpful for spotting shifts in momentum and identifying good entry or exit points – though they work best when combined with other analysis techniques. Ultimately, indicators help uncover patterns you might otherwise miss.
Defining Technical Indicators
Ever wonder how traders anticipate market shifts? They often turn to technical indicators – essentially mathematical calculations using price and volume data. Think of tools like moving averages or the Relative Strength Index (RSI); these trading indicators help spot trends and volatility, offering insights beyond simple price observation and refining trading strategies.
Benefits of Custom Indicators (Personalization, Strategy)
Ever feel like off-the-shelf trading indicators just aren’t quite right? Creating trading indicators customized to your style unlocks a whole new level of control. It’s about fine-tuning your analysis, matching it precisely with how you manage risk and trade. This personalization can really highlight those subtle patterns – giving you a distinct advantage.
Core Concepts: Price Data & Input Types
Knowing how to interpret price data is a real advantage for traders – it’s essentially a window into what’s happening in the market, and it fuels everything we do here. We make getting that data easy with flexible input options like OHLC (Open-High-Low-Close), just prices, and volume; all crucial for building your own trading indicators. Whether you want to create something straightforward or a really complex tool, our system handles CSV and JSON formats seamlessly. Curious? Check out our documentation – let’s get started!
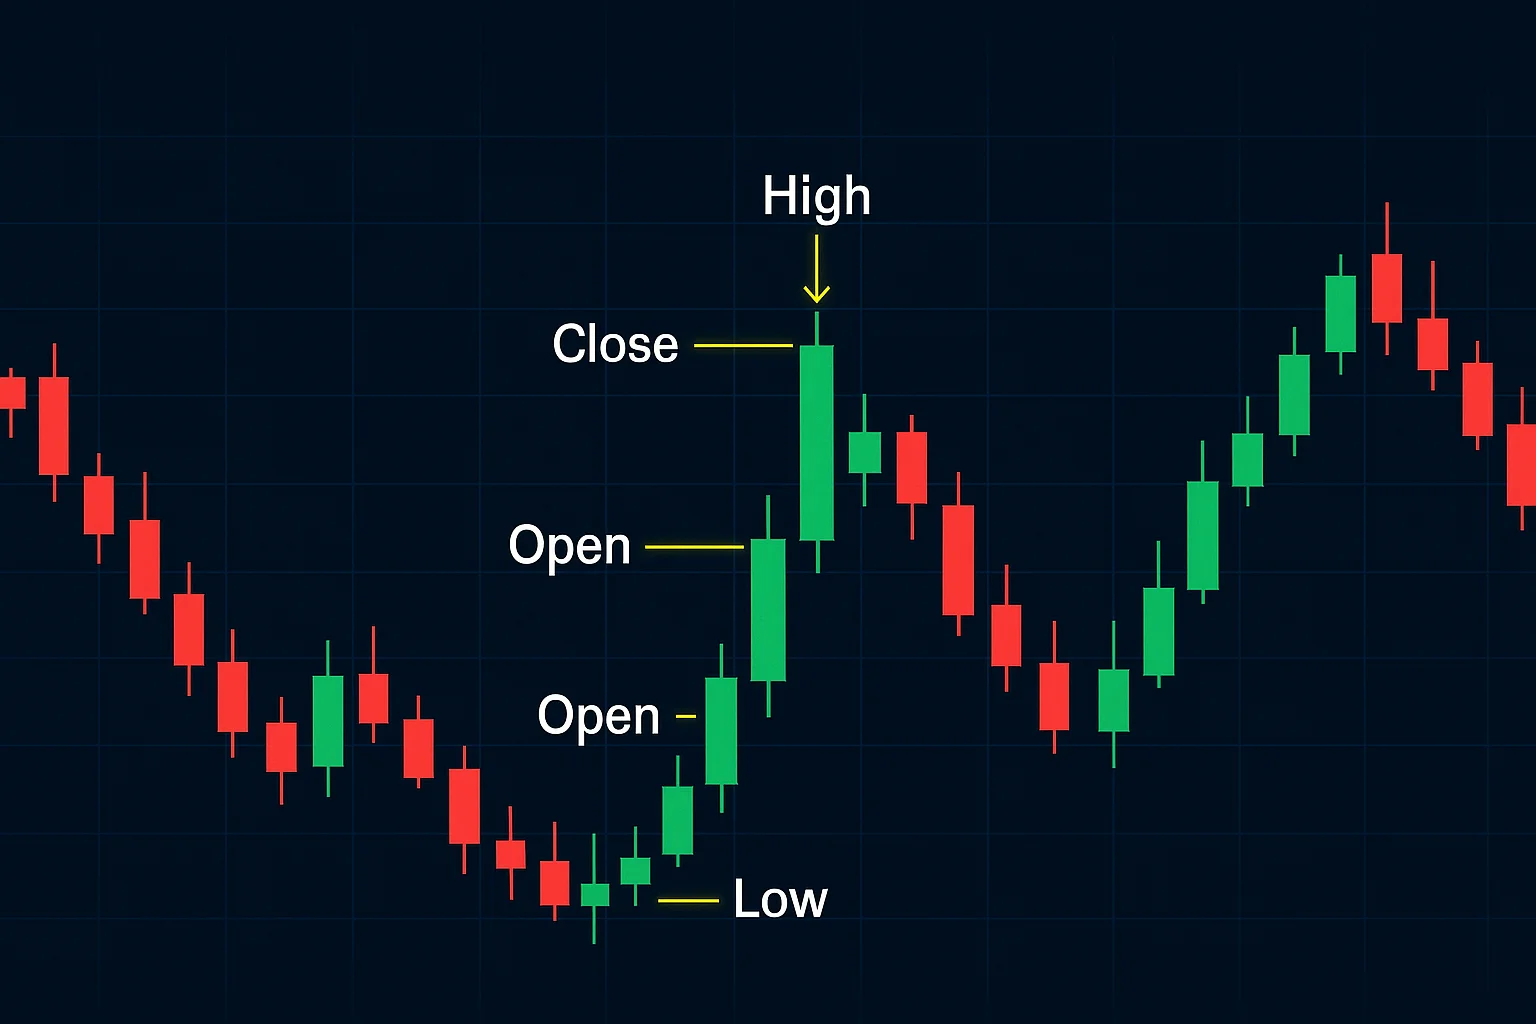
Open, High, Low, Close (OHLC) Explained
Financial charting, particularly candlestick charts, really benefits from understanding OHLC data. Think of it this way: Open is where the price began, High was its peak, Low marks the bottom, and Close shows how things wrapped up for that period. It’s a neat snapshot of what happened! Technical analysts often use these prices to identify trends and potential opportunities – essentially gauging market sentiment and volatility to build trading indicators.
Volume – More Than Just Quantity
Understanding trading volume goes beyond just the number of shares exchanged—it adds vital context! When you see prices climbing alongside rising volume, it often points to strong conviction and a likely upward trend. Conversely, if prices increase but volume drops, that could indicate underlying weakness. Combining volume analysis with price action offers valuable insights; high volume during breakouts can validate them, while low volume suggests proceeding with caution.
Understanding Timeframes and Resolution
Timeframes are really important when doing technical analysis – it’s like looking at a map with different zoom levels! Intraday charts highlight those quick, fleeting trends, whereas weekly views show you the bigger picture. How we interpret signals changes depending on the timeframe; that breakout you see on a short chart isn’t quite the same as one across an entire day. To make better trading decisions, keep this in mind.
Confirming signals using different timeframes is crucial. Many traders use multiple indicators and consider the overall market to avoid costly errors and strengthen their strategy.
Mathematical Building Blocks for Indicator Logic
Navigating the world of trading indicators can seem daunting at first, but it’s actually rooted in some pretty straightforward math! It’s kind of like building a house – you absolutely need a solid foundation. Basic arithmetic, things like addition and subtraction, are those foundational elements. Calculating percentages helps us compare values effectively, and ratios allow us to identify potential trends. When combined, these tools become incredibly powerful for unlocking market insights.
Plus, a little introductory statistics goes a long way. The mean, or average price, gives you an idea of where prices usually settle, while standard deviation tells you how much they fluctuate – essentially measuring volatility. Understanding these mathematical concepts really empowers traders to confidently interpret signals and even develop their own unique indicators.
Basic Arithmetic Operations in Trading
Successful trading relies surprisingly on basic arithmetic! Think of it like balancing your checkbook – addition helps track your portfolio’s total value, while subtraction quickly shows if a trade was profitable. Multiplication lets you estimate potential returns, and division is handy for calculating average costs or figuring out how much to invest. Really, mastering these skills makes smarter decisions easier, especially when assessing profit/loss and managing risk. For example, dividing your capital by a risk percentage can guide optimal trade sizing. Want to brush up on financial literacy? https://www.investopedia.com/terms/a/arithmetic.asp has some great resources; even trading indicators often depend on these fundamentals.
Addition, Subtraction, Multiplication, Division - Practical Examples
For traders, a solid grasp of basic arithmetic is really important! Addition helps you tally up your wins – imagine combining profits from a couple of successful trades. Subtraction lets you figure out losses, while multiplication comes in handy when calculating costs based on quantity and price. Division? That’s useful for splitting gains fairly. Brush up on those fundamentals here.
Percentages and Ratios: Relative Strength & Changes
Understanding percentages and ratios is really important when you’re looking at relative strength in trading. Percentage change gives you a clear picture of how prices are moving, but ratios—like comparing today’s price to a moving average—can offer valuable clues about past performance too. They can even hint at potential shifts in trends! For example, seeing a steady 5% increase might suggest growing momentum. Want to learn more? Check out this helpful resource on ratio analysis https://www.investopedia.com/terms/r/ratiotrading.asp.
Averages and Moving Calculations
Understanding averages, especially moving averages, can really simplify price data and help you identify trends in trading. Simple Moving Averages (SMA) calculate the average price over a specific period, while Exponential Moving Averages (EMA) give more weight to recent prices—think of it as prioritizing today’s news! Both are fantastic for filtering out those short-term fluctuations, giving you a clearer picture of what might happen next. Learning how to use averages effectively is crucial for building your own trading indicators and improving your analysis. Want to fine-tune your approach? Check out our guide to personalize your strategy!
Simple Average (Mean) Explained
Let’s look at the mean, often just called the simple average – it’s a really basic way to understand what’s typical in any set of data! Think about adding up all your numbers and then dividing by how many you have; that’s essentially it. For example, (2 + 4 + 6) / 3 gives you 4. Pretty straightforward, right? This quick calculation helps highlight common data points, making it a key concept for anyone dipping their toes into data analysis or statistics.

Weighted Average – Giving More Importance to Recent Data
Weighted averages offer a clever way to smooth price data and identify trading trends. The beauty of this technique lies in giving more importance to recent information – after all, what’s happening now usually matters most! It’s like filtering out the static to get a clearer picture of the current trend. Imagine tracking stock prices; focusing on the last few days really highlights immediate momentum.
Constructing Indicators with Logic
Want to really fine-tune your technical analysis? Creating custom trading indicators is a brilliant way to do just that! It’s essentially about using logical operations – things like AND, OR, and NOT – to combine the data you’re already watching. Think price action, volume, moving averages…you name it. For example, wouldn’t it be great to have an indicator that signals a buy when a short-term average climbs above a longer one and trading volume is picking up? That kind of targeted insight becomes possible.
You don’t need to be a mathematical genius for this either! Simple calculations paired with logical conditions can unlock some serious power. Here are a few ideas:
- Price goes higher than yesterday’s close.
- The Relative Strength Index (RSI) dips below 30.
By connecting these rules, you can develop truly sophisticated trading indicators that perfectly align with your unique trading style and how you see the market.
Conditional Statements (If/Then) in Indicator Design
Conditional statements—especially ‘if/then’ logic—are absolutely vital when building custom trading indicators. It’s like giving your indicator a brain; it can react differently based on what the market is doing! Imagine, for example, a moving average signal only appearing when volume spikes. This kind of responsiveness makes analysis much sharper and could lead to better trade decisions. With conditionals, you can craft truly sophisticated trading indicators tailored to your strategy, filtering out unnecessary noise and highlighting those promising opportunities.
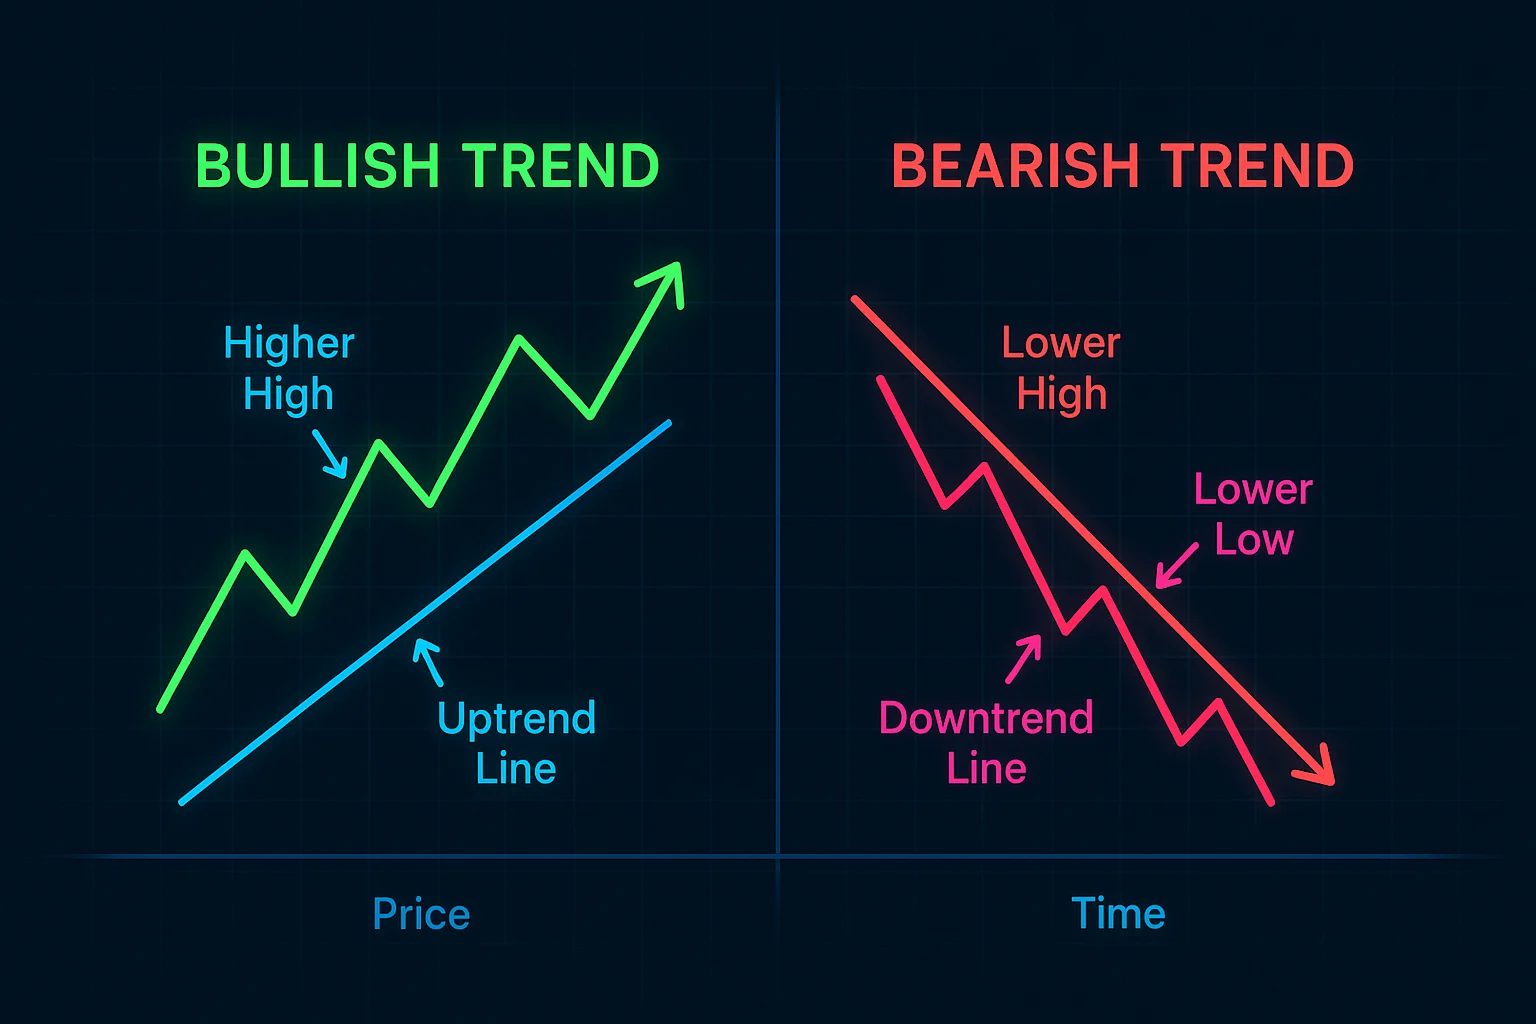
Identifying Bullish vs. Bearish Conditions
Understanding whether a market is bullish or bearish is key to successful trading. Bullish markets show rising prices – imagine that increasing momentum driven by good news! On the other hand, bearish conditions mean falling prices and increased selling; it’s wise to be careful. Tools like moving averages and the relative strength index (RSI) can offer clues about these shifts, helping you spot chances or protect yourself.
Setting Thresholds for Signals
Finding the right thresholds for technical signals – like RSI or moving average crossovers – really matters for successful trading. It’s similar to tuning a radio; you adjust levels based on how volatile the market is, increasing them when things get chaotic and lowering them when it’s calm. Backtesting various combinations is essential, and remember striking that balance between catching more trades while also reducing false alarms can be tricky!
Loops: Dynamic Calculations Over Time
Loops are fundamental in programming – they let us repeat tasks and really dig into data efficiently. Imagine calculating a daily moving average; a loop would walk through historical prices, doing the calculation each day. That’s how you spot trends within datasets! This is incredibly useful for things like financial modeling and creating trading indicators. By repeatedly applying formulas, we can test different scenarios and gain valuable insights. Building custom trading indicators relies heavily on loops, giving traders a way to personalize their analysis. Ready to unlock the power of loops?
Applying Calculations Across Multiple Price Points
Figuring out strong trading strategies often involves calculations like the Relative Strength Index (RSI) and moving averages – really digging into those price points! Think about it: a bullish signal popping up every day; seeing that on an hourly chart can quickly confirm a promising opportunity. Consistent use reveals clearer patterns, you know?
Of course, signals shift, so what looks like a high RSI in one timeframe might actually indicate overbought conditions somewhere else. This adaptability is key – it allows traders to refine their analysis and even build custom trading indicators by cross-validating across different timeframes.
Building a Simple Moving Average (SMA) Indicator – A Step-by-Step Guide
Want to dive into custom trading indicators? Creating a Simple Moving Average (SMA) is a great place to start! It’s surprisingly straightforward, even if you’re new to this. Think of an SMA as smoothing out price bumps – it averages closing prices over a specific timeframe, kind of like calculating your overall grade by averaging several test scores. Let’s walk through building one together; you don’t need to be a coding expert for this!
Here’s the basic process: first, pick your timeframe—maybe 20 periods sounds good. Then, add up all those closing prices within that period and divide by the number of periods. Keep repeating these steps as you move along the chart. That resulting series is your SMA! Remember to always test and tweak your indicators with historical data before using them in real trading.
Calculating the SMA: The Formula Explained
Figuring out the Simple Moving Average, or SMA, is surprisingly straightforward! Basically, you take an asset’s closing prices over a specific timeframe – say, 20 days – add them together, and then divide by that number. The result? A smoothed average price, which can be really useful for identifying trends. Understanding this calculation is key to technical analysis.
The formula itself is simple: (Sum of Closing Prices / Number of Periods). Think about a 10-day SMA – you’d just divide the total closing prices from the last ten days by ten. This easy indicator helps filter out some market noise and can highlight potential support and resistance levels. Want to learn more? Explore other trading indicators to sharpen your analysis!
Choosing the Period Length (e.g., 10, 20, 50 days)
Selecting the ideal period length for technical indicators—like moving averages—is really important. Shorter periods are quick to react to price changes, almost like a dancer’s swift moves, but they can sometimes give false signals. Longer periods offer clearer trend views, though they’re slower to respond. Consider your trading style; short-term folks might use 10 to 20 days, while long-term investors could opt for 50 or more. Backtesting different settings is a great way to find what works best.
Smoothing Price Data with the SMA
Smoothing price data is essential to see through market noise and identify genuine trends. The Simple Moving Average (SMA) does this by averaging prices—say, over 20 days—which reduces volatility. It’s a great way to get a clearer picture of the direction! Building custom trading indicators like the SMA can really enhance your analysis.
The SMA filters out those short-term fluctuations, so observing how it shifts helps traders spot potential support and resistance levels. It’s truly a foundational tool for anyone beginning with technical analysis.
Expanding Your Knowledge: Common Indicator Patterns & Adaptations
Becoming a successful trader really hinges on understanding common indicator patterns – things like the head and shoulders, double tops/bottoms, and triangles are pretty well-known signals suggesting potential shifts in the market. For example, that head and shoulders pattern often points to an upcoming downtrend after a period of growth; it’s a sign buying strength is fading. Spotting these formations can give you some really valuable clues about where prices might be headed next.
Of course, just looking at patterns isn’t enough! Smart traders adjust their strategies based on what’s happening and look for confirmation from other tools – no pattern is foolproof. Combining pattern recognition with volume analysis, trendlines, and good risk management will lead to better decisions and help you adapt to changing market conditions. Ultimately, mastering these skills significantly improves your trading indicators expertise.
Relative Strength Index (RSI) – Adapting Average Calculations
The Relative Strength Index (RSI) is a popular momentum indicator, typically using a 14-period calculation – but don’t be afraid to tweak it! Shorter periods, like 9, react quickly to price changes and can be useful for day trading. On the other hand, longer settings, say 21, provide a smoother perspective that’s better suited for long-term strategies. Ultimately, finding what works best depends on your individual approach and what you’re trading; shorter periods might generate more false signals, while longer ones could cause you to miss important opportunities. Customizing these calculations can really enhance your trading indicators experience.
Understanding Overbought and Oversold Levels
Technical analysis often looks for overbought and oversold levels—essentially, signs a stock’s price might be due for a change of direction. Imagine a stock climbing too quickly; that’s potentially overbought, suggesting a pullback could happen. Conversely, an oversold situation hints at a drop that could soon recover. The Relative Strength Index (RSI) is one tool to help identify these moments. Remember though, these are just clues—always consider other indicators and the overall market before making any trades!
Moving Average Convergence Divergence (MACD) - Combining Averages
The Moving Average Convergence Divergence (MACD) indicator is a really useful tool for traders trying to gauge price trends. It cleverly uses two Exponential Moving Averages – typically 12 and 26 days – which gives more importance to recent prices compared to simpler moving averages. You could think of EMAs as reacting quicker! The MACD line itself displays the difference between these averages, with a shorter Signal line trailing right behind. Keep an eye out for crossovers and divergences; they can suggest potential trading opportunities. Want to dive deeper? Check out our guide for building custom trading indicators and tailoring your analysis.
Identifying Trend Changes and Momentum Shifts
Staying ahead in trading means paying close attention to what’s happening in the market! Really watch that price action and volume – when prices move sideways but volume drops, it can suggest a trend is losing steam. Spotting these shifts helps you anticipate changes and tweak your approach. Remember to confirm with multiple signals before jumping to conclusions about a trend change.
Visualizing and Analyzing Custom Indicators with flows.trading
Want to really dig into market data? flows.trading offers traders a fantastic way to visualize and analyze custom trading indicators. It’s like having a flexible whiteboard right at your fingertips, letting you display your own unique data alongside standard price charts – pretty handy for getting a clearer picture of what’s happening! You can zoom in, pan around, and explore how these indicators behave across different timeframes.
Whether you’re looking to spot trends, gauge volatility, or study volume, flows.trading presents your indicators clearly. This makes backtesting and optimizing custom indicators a breeze, whether you’re building automated systems or just refining your manual strategies – all within an easy-to-use platform.
Implementing Indicator Logic in flows.trading
Want to automate your trading? Implementing indicator logic in flows.trading makes it surprisingly easy! It’s like taking a formula you already know—like the Relative Strength Index (RSI)—and turning it into code within your flow definitions. You’ll set up variables to monitor past prices and use handy built-in functions for calculations.
Calculating RSI, for example, involves moving averages of gains and losses. flows.trading simplifies this by letting you create reusable functions, really streamlining trading indicators. Plus, effectively managing those intermediate results with flow variables is key to building strong, reliable strategies.
Connecting to Price Data for Real-Time Visualization
To really level up your trading game, think about bringing real-time price data into your visualization dashboard – it’s a big help! Many traders connect to APIs like Alpha Vantage or IEX Cloud; they offer live price updates that make charts much more dynamic. Alternatively, you could explore web scraping (just be sure you have the right permissions!), pulling data straight from websites. Ultimately, having reliable and timely information is essential for accurate trading indicator analysis.
Backtesting and Strategy Refinement within flows.trading
Developing a solid trading strategy doesn’t have to be complicated. With flows.trading, you can streamline the process thanks to its integrated backtesting tools – it’s like having historical data right at your fingertips! Easily adjust parameters and timeframes to really dig into potential strategies and make smarter choices. Refining your approach is key; consider win rates, drawdowns, and profitability to identify areas for improvement. flows.trading encourages continuous testing and optimization, helping you sharpen your trading skills. Why not start building custom trading indicators now?
Performance Tracking & Optimization
Seeing how your trades are performing is really key for long-term success! Regularly checking things like your win rate and average profit/loss—plus keeping an eye on drawdown—can offer some great insights. Spotting patterns in these actionable metrics helps you understand what’s working well and where you might need to adjust. When a trade doesn’t go as planned, take a look: was it the market moving unexpectedly or something about your strategy? Consistent review of your trading data is how you keep getting better.