Understanding Objective and Subjective Trade Data Definitions
Table of Contents
Distinguishing Objective Trade Data
When analyzing your trades, it’s crucial to separate hard numbers from fuzzy feelings. Objective trade data is all about clear, measurable stuff like price points, volume, and technical indicators that show what’s really happening in the market.
For example, if a stock’s trading volume spikes above its 50-day moving average, you have a concrete signal that more people are interested in buying it. This kind of data helps you make decisions based on facts rather than gut feelings or guesswork.
How do specific price levels and volumes help you make better trades?
Key Quantifiable Elements in Trading
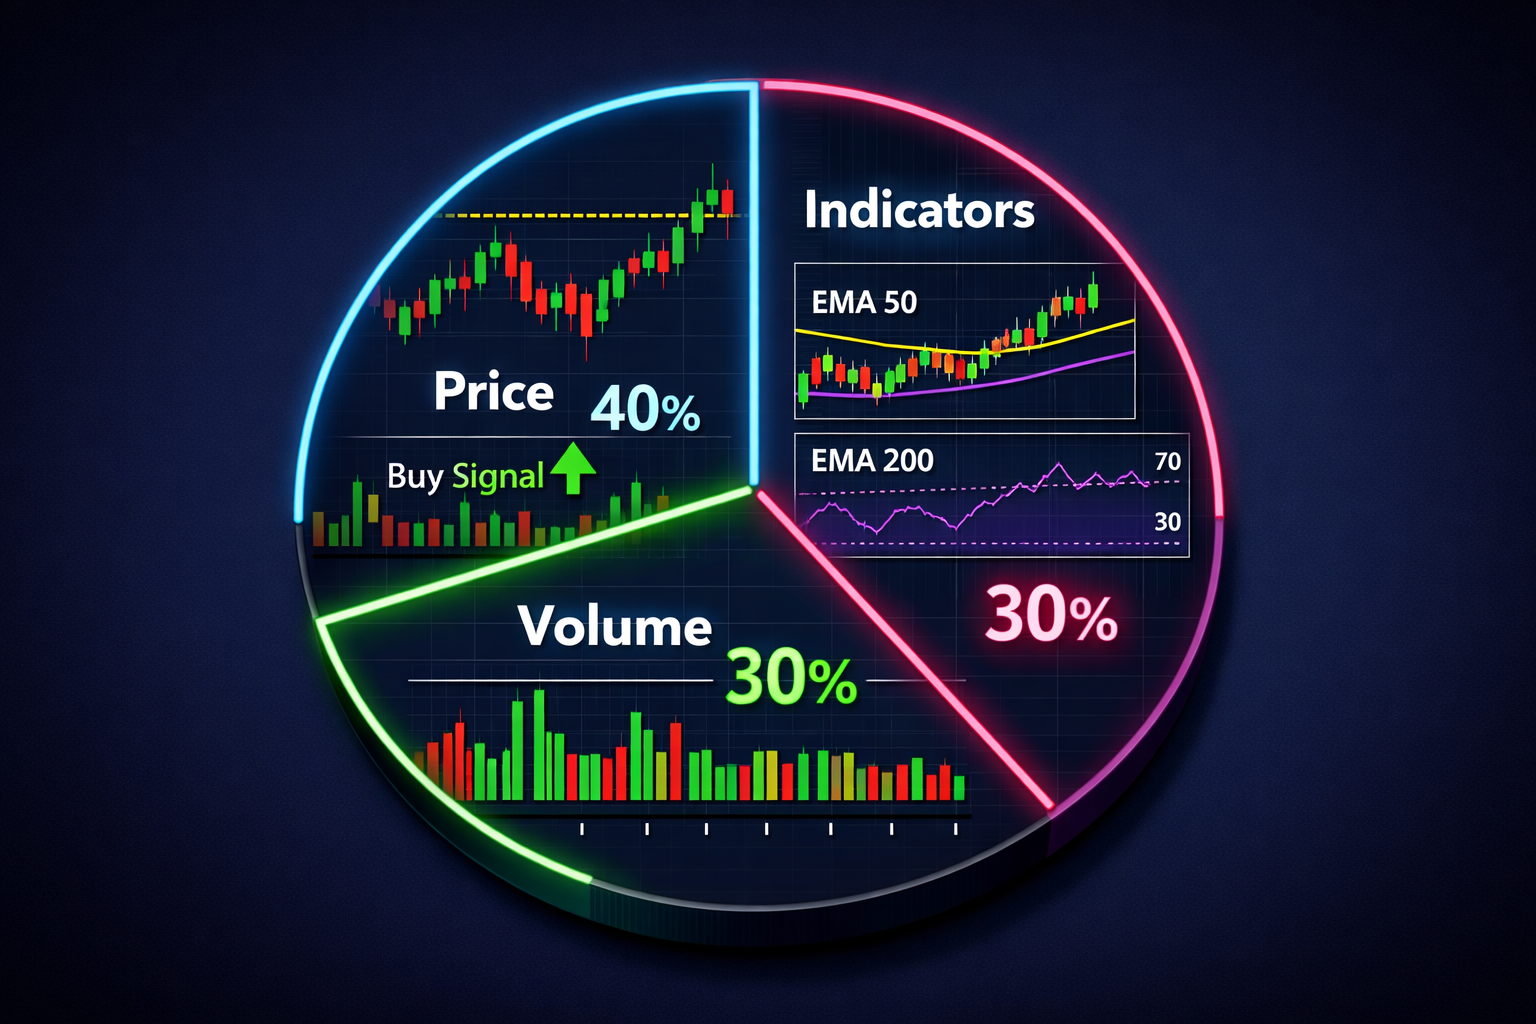
When making trading decisions, it’s important to focus on quantifiable elements like price levels, volume, and technical indicators rather than relying solely on market sentiment. These factors provide objective data that helps traders make informed choices.
Here’s a breakdown of the key quantifiable elements:
| Element | Description | Impact on Decision-Making |
|---|---|---|
| Price Levels | Specific points where significant buying or selling activity occurs, indicating support and resistance. | Helps identify optimal entry and exit points by highlighting areas of high interest to traders, signaling potential reversals in market direction. |
| Volume | The number of shares traded during a period, reflecting the strength behind price movements. | High volume on price changes suggests reliable signals, as it indicates stronger conviction among participants. Low volume with significant moves may hint at weaker trends or potential reversals. |
| Technical Indicators | Mathematical calculations based on historical data to predict future price action, such as moving averages and RSI (Relative Strength Index). | Provide objective measures like trend direction, momentum, and overbought/oversold conditions, aiding in timing trades more accurately by reducing emotional bias. |
Price levels are crucial for identifying support and resistance areas where traders place orders due to psychological significance or previous price action. Volume provides insights into the intensity of market moves; high volume confirms trends while low volume raises questions about sustainability.
Technical indicators offer a quantitative approach, providing clear signals based on historical data patterns rather than subjective interpretation. By integrating these elements, trading decisions are grounded in verifiable information, minimizing emotional influence and maximizing objective analysis.
Understanding these quantifiable factors helps traders navigate markets with confidence and precision. Leveraging price levels, volume, and technical indicators can enhance your trading strategy by making more informed decisions.
Next time you analyze a trade setup, consider how these elements align to guide your decision-making process. This approach not only enhances accuracy but also builds resilience against market volatility.
Technical Analysis offers detailed insights into leveraging technical indicators for robust trading strategies.
Which specific tools from the list have you found most useful in your trading journey?
Grasping Subjective Trade Data
Subjective trade data includes your personal observations and emotional responses that can influence your trading decisions. For example, feeling overly confident after a few winning trades might cause you to ignore warning signs on a chart. On the other hand, anxiety about market volatility could lead you to make impulsive buys without proper analysis.
Keeping a trading journal is key here. By writing down your feelings along with objective data, you can spot patterns of bias that hurt your decision-making. This helps you stay disciplined and follow strict exit rules based on technical indicators rather than gut feelings.
Ignoring emotional factors can result in significant financial losses. Understanding subjective trade data lets you balance both types of information for a more well-rounded approach to trading.
Personal Observations in Trading
Sarah, an experienced trader, has noticed that a particular stock tends to rise after quarterly earnings announcements. Over 10 quarters, the price went up by at least 5% in seven periods. She keeps track of these patterns in her trading journal to predict how similar stocks will behave during earnings season.
Relying solely on quantitative data like price levels and volume can miss important nuances. For example, the stock might spike in volatility right after an earnings announcement before settling into a predictable pattern. This kind of behavior isn’t always clear from just looking at numbers.
By blending personal insights with objective metrics, traders can make better decisions. Combining what you observe with quantitative data helps increase profitability by giving you a fuller picture of market behavior.
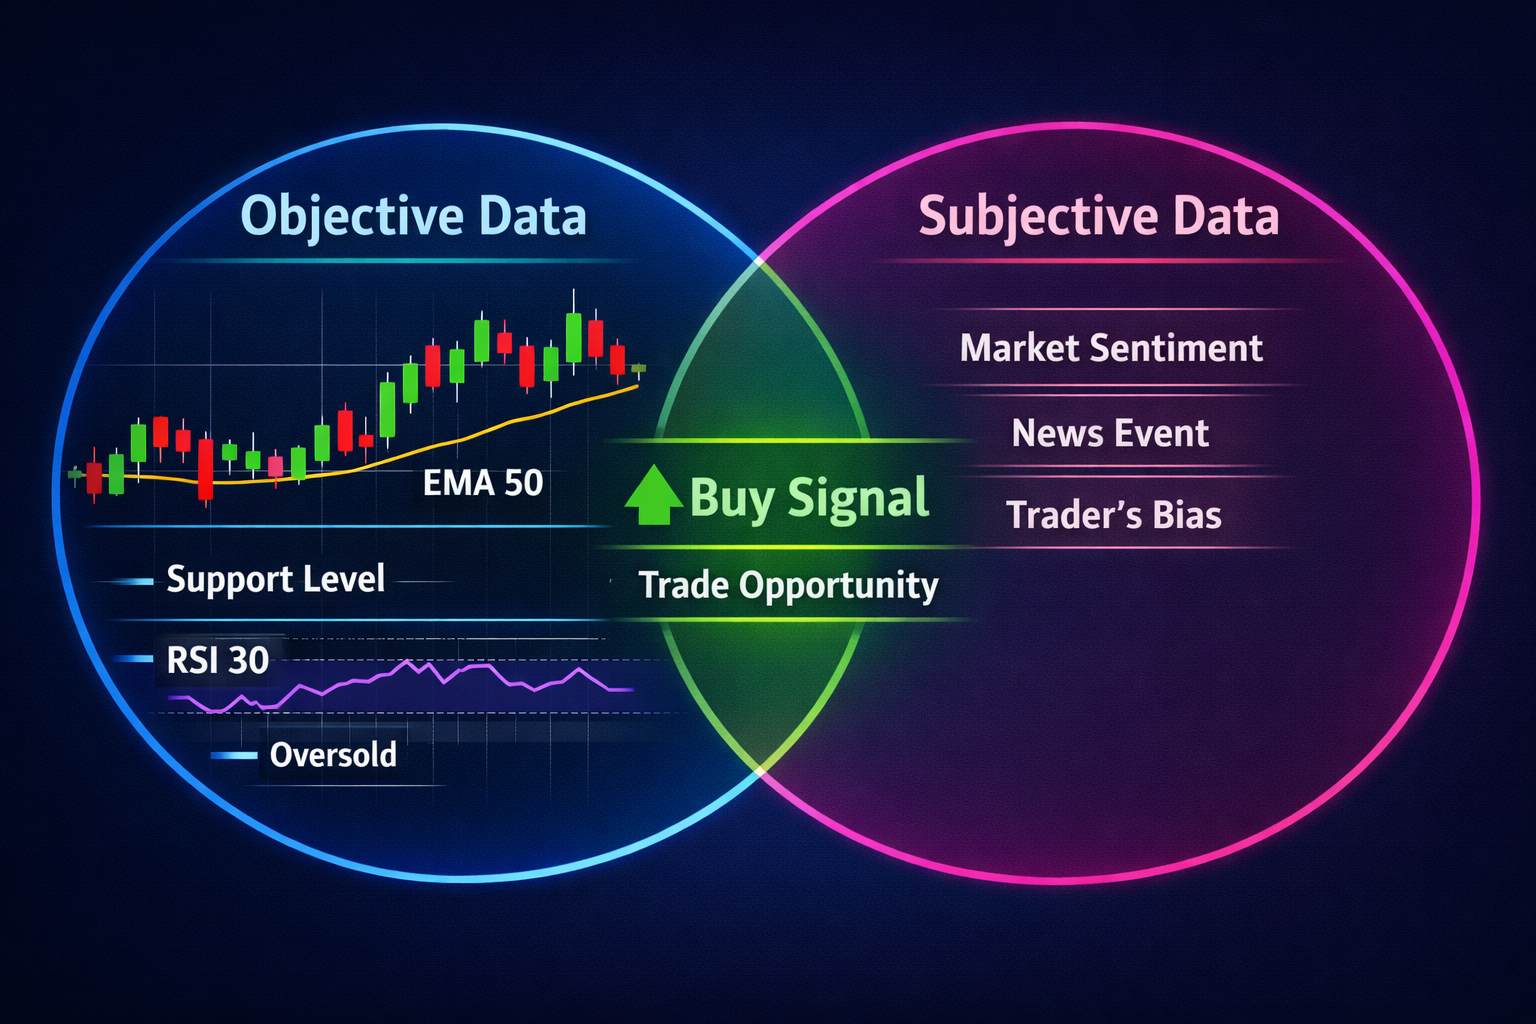
Role of Both Types in Analysis
Identifying key objective data points like price levels and volume is crucial for making smart trading choices. These metrics give you concrete evidence that supports or contradicts your ideas. Adding subjective observations, such as market sentiment, can enhance your decision-making, but it’s important to verify these insights with the hard numbers.
For instance, spotting historical patterns through chart analysis complements current quantitative indicators like moving averages or RSI scores. Keeping track of your emotions also helps; journaling your feelings before and after trades lets you see any biases that might affect your judgment.
Ignoring either objective data or subjective observations can lead to an unbalanced approach. To ensure your qualitative insights are reliable, use a trading journal to track both types of data systematically. This reinforces the integration of emotional insights with hard facts.
Without guidance on combining these elements, you’ll struggle to make informed decisions based on incomplete analysis. Integrating objective and subjective factors ensures well-rounded decision-making in trading.
Complementary Use of Data
When integrating trading decisions with both objective and subjective data, follow these steps:
- Identify Key Metrics: Start by pinpointing important quantitative factors like price levels, volume, and technical indicators. Use Trading Signals to track significant market movements.
- Document Personal Observations: Keep a detailed trading journal that includes your subjective insights. For instance, note unusual stock behavior after earnings announcements in your Trading Journal Apps.
- Analyze Chart Patterns: Look for recognizable patterns on charts to complement quantitative data. Use Chart Patterns to identify trends that align with your objective metrics.
- Evaluate Emotional Impact: Recognize how personal feelings might affect decisions and mitigate emotional bias using techniques from Avoiding Emotional Bias.
- Combine Insights: Make final trading calls by integrating both data types. For example, if technical indicators suggest a sell signal but your journal reveals unusual market behavior, consider waiting for more confirmation.
Failing to combine these insights can lead to overly risky or conservative decisions based solely on gut feelings or strict quantitative analysis, respectively. With this balanced approach, you’ll have a clearer view of the market and better handle emotional influences on trading.
Common Mistakes in Data Integration
What are common mistakes beginners make when integrating subjective and objective trade data?
- Overlooking Emotional Impact: Ignoring your emotions and biases can lead to hasty decisions.
- Ignoring Subjective Observations: Disregarding personal insights that provide crucial context.
- Mismanaging Model Risk: Relying too heavily on a single model without considering its limitations. Model Risk Management
- Inadequate Data Verification: Using unreliable data sources can lead to flawed analysis. Always verify information credibility.
- Overemphasizing Objective Metrics: Relying solely on quantitative measures while neglecting qualitative factors like market sentiment and personal experiences.
- Lack of Integration Techniques: Failing to develop methods for combining subjective and objective data results in fragmented insights.
To avoid these pitfalls, make sure you integrate both types of data systematically. This helps ensure no critical element is missed.
Practical Synthesis: Next Steps
For beginners looking to integrate both objective and subjective trade data effectively, here are some actionable steps:
- Record daily trading activities: Write down every trade you make, including key price levels, volumes, and technical indicators. Journaling Benefits
- Reflect on emotional triggers: After each session, note any emotions or biases that affected your decisions.
- Identify patterns in data: Look for correlations between objective data and subjective feelings by analyzing your journal entries.
- Set specific goals for improvement: Define clear objectives based on insights from your analysis. For example, aim to reduce impulsive trades driven by fear.
- Review performance regularly: Schedule weekly reviews of your trading activities and emotional states to refine your strategy.
If you only focus on emotions without concrete data, new traders tend to make inconsistent decisions. Combining both types of information helps build a more balanced approach that improves decision-making skills. Avoid vague advice like “be aware of your emotions” in favor of specific actions such as journaling and setting clear goals.
Introduction to Trade Data Analysis
Trade data analysis is a critical component of successful trading strategies. Understanding the nuances between objective trade data and subjective trade data can significantly impact your decision-making process. Objective trade data refers to quantifiable metrics that are not influenced by personal opinions or biases, such as volume and price trends. On the other hand, subjective trade data involves qualitative assessments based on individual interpretations of market conditions. By leveraging both types effectively, traders can gain a more comprehensive view of market dynamics.
- Objective Trade Data: Quantifiable metrics like volume and price trends
- Subjective Trade Data: Qualitative assessments influenced by personal opinions
Related Articles on Flows Trading Academy
To deepen your understanding of trade data analysis, consider exploring these related articles from the Flows Trading Academy and other sections within the academy.
Applying Metrics and Signals for Informed Decisions
Using metrics to inform trading decisions is essential. The Flows Trading Metrics provide valuable insights into market conditions, enabling traders to make data-driven choices. Additionally, understanding different types of chart patterns can enhance your visual analysis skills and help identify potential trade opportunities.
- Metrics: Inform trading decisions with real-time data
- Chart Patterns: Identify trends and signals visually
Benefits of Trading Journaling
Keeping a detailed trading journal is one of the most effective ways to improve your trading performance. By documenting each trade, you can review past decisions and identify patterns that influence success or failure. The Flows Trading Journal offers tools specifically designed for this purpose.
- Review Past Decisions: Analyze successes and failures
- Identify Patterns: Improve future trading strategies
Further Reading Links
For more detailed information on enhancing your trading skills, explore these additional resources provided by Flows Trading. These guides cover everything from technical analysis to journaling benefits and can help you refine your approach.
Apply Your Knowledge with Flows Trading
Flows Trading offers a comprehensive platform featuring advanced trading features and tools to help you implement your knowledge effectively. From real-time metrics to robust journaling capabilities, the platform is designed to support all aspects of successful trading.
- Advanced Features: Comprehensive trading tools
- Real-Time Metrics: Stay informed with up-to-date data