Understanding How to Record Market Conditions
Table of Contents
Overcoming Hindsight Bias in Recording Market Conditions
When reviewing past trades, it’s common to notice inconsistencies in your trading journal. You might capture positive outcomes perfectly but overlook important details after a loss, leading to hindsight bias.
To avoid this:
- Log market conditions as they happen: Write down the details right away while you’re still in the moment. Don’t wait until later when trade results might influence your notes.
- Be objective about trends: Use technical analysis tools like moving averages and chart patterns at the time of observation to identify trend patterns, rather than adjusting them after the fact based on outcomes.
- Include liquidity factors: Note trading volume and bid-ask spreads to accurately reflect market depth. These details help paint a clearer picture of market conditions.
- Don’t tweak notes later: Resist changing initial observations after reviewing trade outcomes; stick with the real-time data you recorded initially.
By following these steps, your records stay unbiased and useful for future analysis. If you don’t address hindsight bias, your historical data becomes unreliable, weakening the effectiveness of future trading strategies. Adjusting market conditions based on trade results only justifies past decisions without offering true insights.
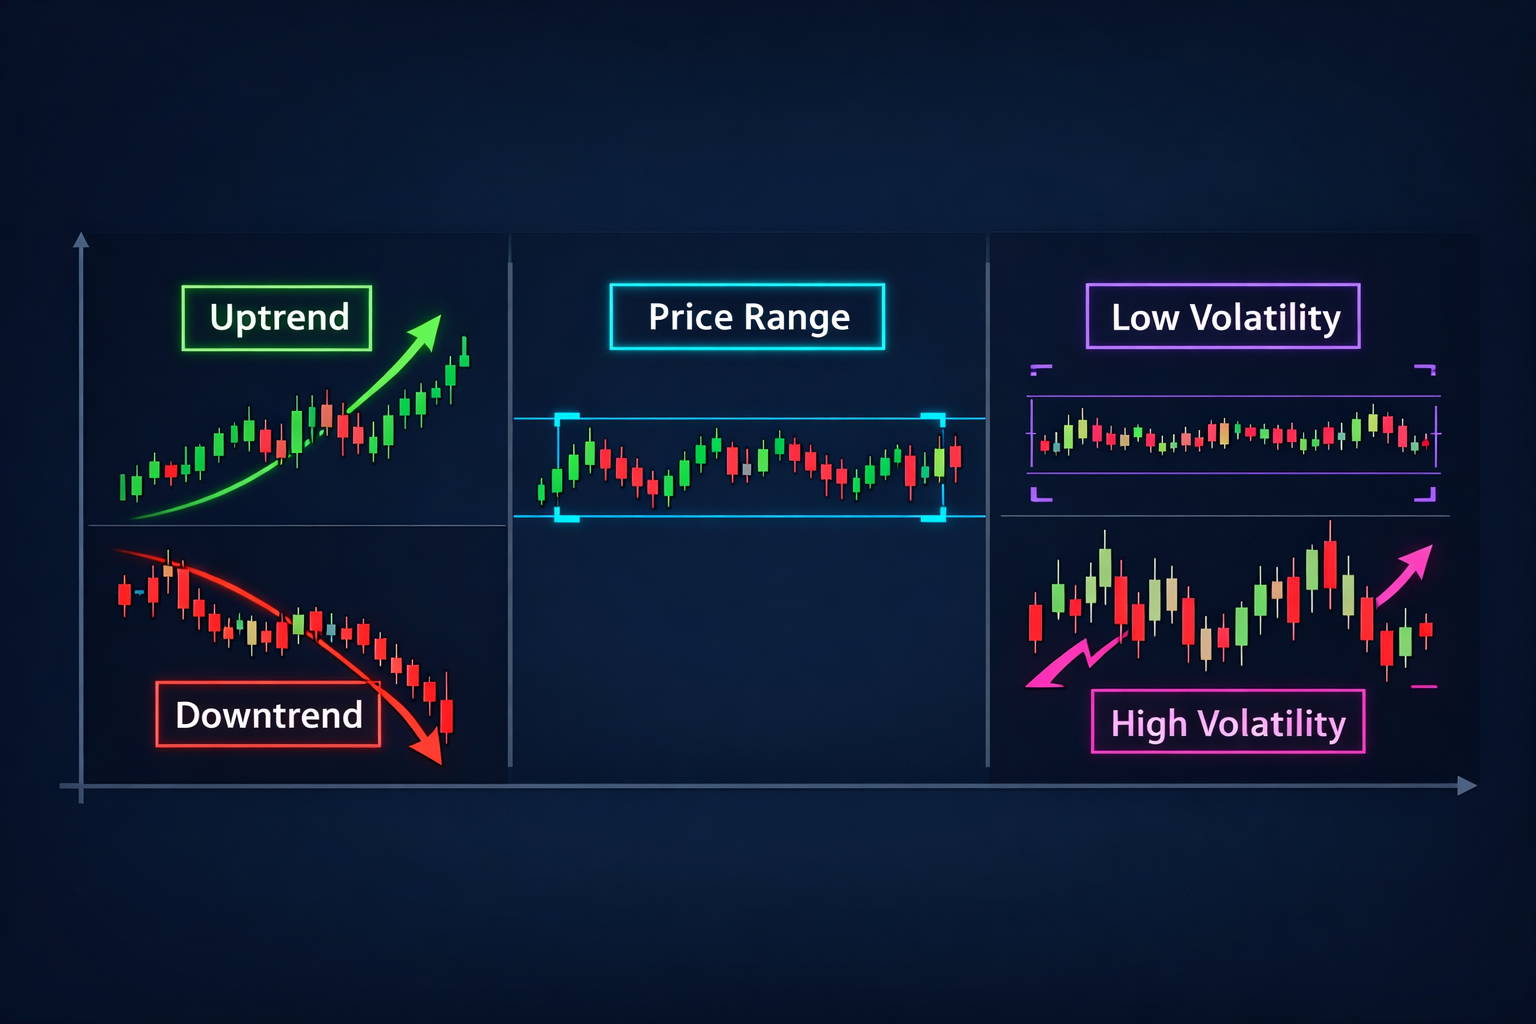
Identifying Trend, Range, and Volatility Contexts
- Start by opening your trading platform and picking a chart for the asset you want to analyze. Choose an appropriate timeframe based on how long the trend might last: daily charts if it’s a long-term trend or hourly/5-minute charts if it’s short term.
- Add moving averages to help figure out the direction of the trend. Use one shorter term (e.g., 10-period) and one longer term (e.g., 30-period). When the shorter MA crosses above the longer, it signals a bullish trend; when it falls below, it signals a bearish trend.
- Identify support and resistance levels by marking areas on your chart where price reversals usually happen due to buying or selling pressure.
- Calculate daily high-low ranges over 10-20 days to determine the asset’s trading range. This helps you set stop-loss orders based on typical price movements.
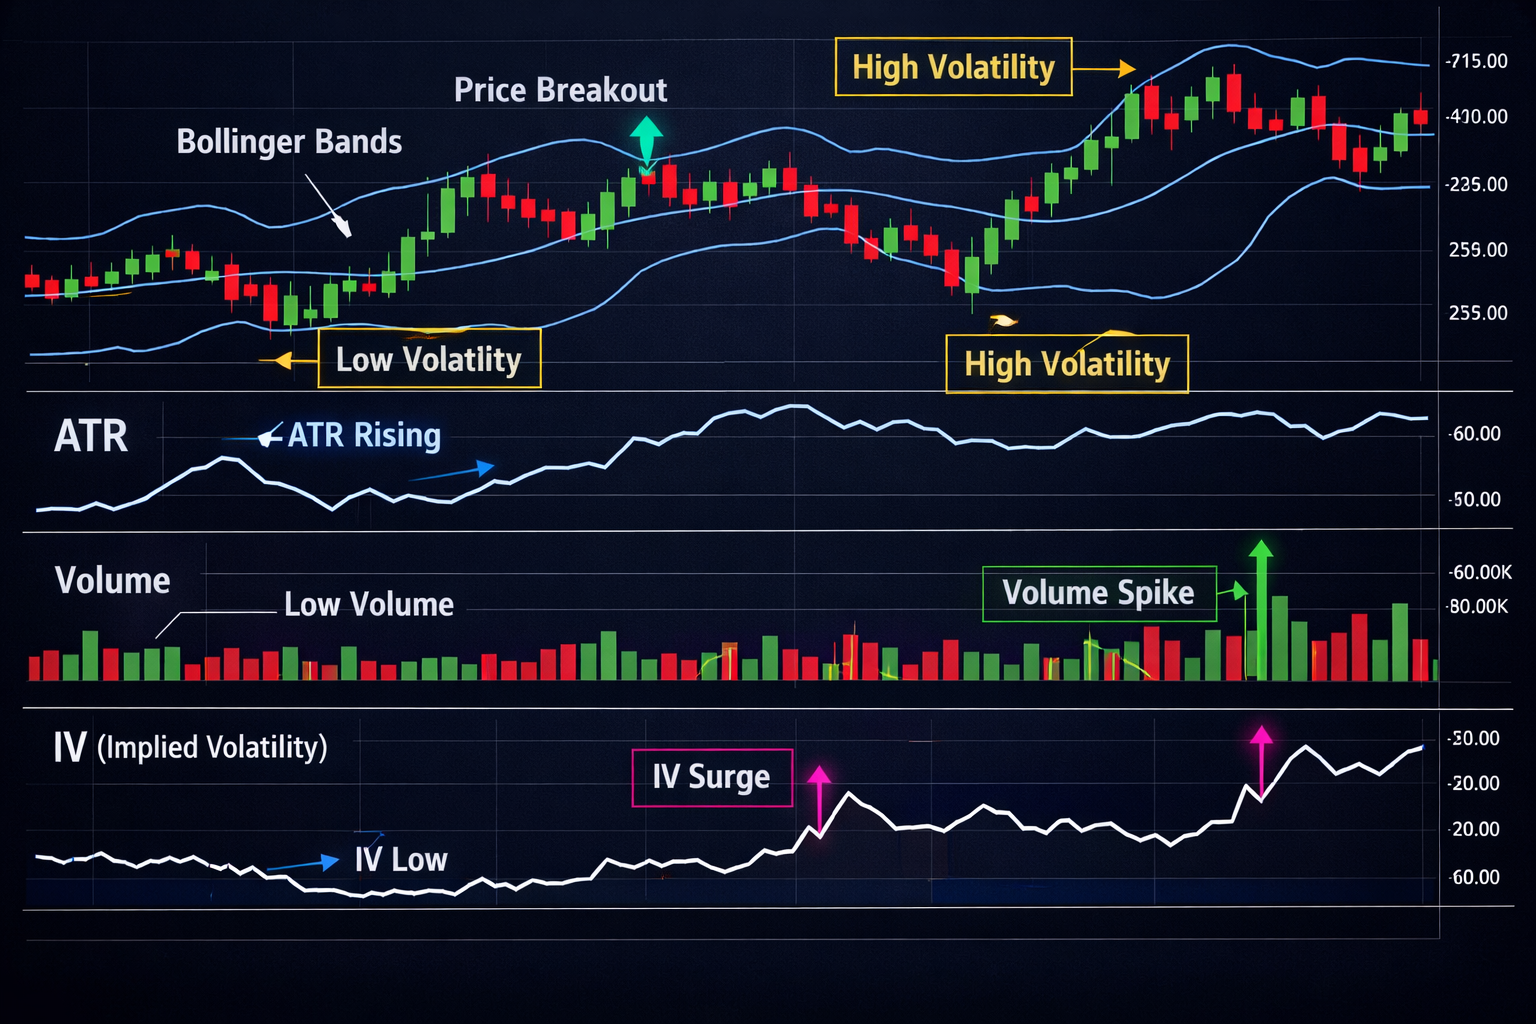
- Use volatility indicators like Bollinger Bands or Average True Range (ATR) to measure how much prices are moving around. Adjust your strategy for high-volatility or low-volatility periods accordingly.
- Document all observations in your trading journal, noting the exact date and time of analysis along with any relevant market news that might impact trends and volatility levels.
- Regularly review previous entries to spot patterns and improve future analyses, ensuring you stay ahead of market changes and make better decisions.
Ignoring these steps can lead to misinterpreting market conditions and making poor trading decisions. Relying on intuition instead of technical indicators for trend identification increases the risk of incorrect analysis significantly.
After documenting trend and volatility, assess liquidity factors to ensure the asset is tradeable under current conditions.
Assessing Liquidity or Session Conditions
Assessing liquidity factors is crucial for traders to figure out the best times to execute trades. Liquidity varies significantly across different trading sessions, like European, US, and Asian markets, due to differences in active hours and trading volumes.
| Trading Session | Peak Hours (UTC) | Average Daily Volume (USD billions) | Typical Spread (pips) |
|---|---|---|---|
| European | 7:00 AM – 12:00 PM | 450 | 6 |
| US | 13:00 PM – 8:00 PM | 900 | 4 |
| Asian | 23:00 PM – 6:00 AM | 150 | 8 |
For example, the European session offers moderate liquidity and spreads but sees significant price movements during its overlap with US markets. The US session has the highest trading volume and narrowest spreads, making it ideal for aggressive trading strategies. In contrast, the Asian session experiences lower activity and wider spreads due to fewer active participants.
During off-peak hours, traders often face challenges such as increased bid-ask spreads and slower order execution times, which can lead to higher transaction costs and reduced profitability. For instance, executing a large position during the overlap of European and US sessions (around 13:00 PM UTC) would yield tighter spreads compared to Asian session hours.
Understanding these nuances is essential for tailoring trading strategies to maximize efficiency under varying liquidity conditions. Keep track of your observations in a trading journal to avoid hindsight bias, which helps with objective analysis of past trades and informed decision-making moving forward.
Think about how you currently assess liquidity during different sessions. This can highlight opportunities for improving your trading strategy.
The Pitfalls of Subjective Assessment in Trading
Relying solely on subjective methods to record market conditions can lead traders to overlook important details and make decisions based on feelings rather than facts. For example, a trader might think volatility is high because they read positive news but doesn’t have actual price movement data to back it up.
Subjective assessments introduce personal bias, causing you to misinterpret market signals and leading to poor risk management. Instead of going with gut feelings, use technical indicators like Bollinger Bands to measure volatility objectively. By consistently logging such data, you build a reliable record for future analysis.
To avoid the pitfalls of subjective assessment, start using a trading journal that captures objective metrics from each trade. This improves decision-making and helps you identify past mistakes. Objective Trading Importance highlights how crucial this approach is for effective risk management.
How will you start logging objective data in your trading journal?
Building an Objective Context Record
When building an objective context record for your trades, follow these steps:
- Identify Key Indicators: Use technical analysis tools like moving averages and RSI values to spot key indicators when entering a trade.
- Document Market Conditions: Note the trend direction, volatility levels, and liquidity factors based on real-time data. Avoid relying on gut feelings or past experiences.
- Record Volatility Levels: Track current volatility to gauge market risk accurately. High volatility means higher uncertainty and bigger price swings, which can impact your trades.
- Log Liquidity Data: Check trading volume and bid-ask spreads to ensure smooth entry and exit without slippage.
- Avoid Subjective Interpretation: Stick to clear, quantifiable measures instead of personal opinions or emotional reactions. Use trade data analysis techniques to stay objective.
By following these steps, you’ll base your trading decisions on market facts at the time of entry rather than how you felt about it later.
Recording Market Trends and Ranges
To accurately document market trends and price ranges without bias, follow these steps:
- Identify trend direction: Use tools like moving averages or trend lines to see if the market is going up (bullish), down (bearish), or sideways.
- Define range boundaries: Clearly mark support and resistance levels on your charts to identify high and low price limits within a trading session.
- Record volatility measures: Note key metrics such as Bollinger Bands and Average True Range (ATR) to quantify market fluctuations accurately.
- Document liquidity factors: Assess volume trends alongside price movements to understand market depth and potential for large trades.
Avoid hindsight bias by reviewing past entries objectively, sticking strictly to observable data points rather than emotional or post-event analysis. Logging specific indicators consistently helps ensure accurate trend and range assessments, which are crucial for making informed trade decisions.
Evaluating Volatility Levels
When trading the S&P 500 index and noticing increased volatility, it’s important to focus on current data rather than past averages. For example, if today’s VIX reading is 23 compared to its usual monthly average of 18, this signals higher uncertainty.
Relying solely on historical figures can mislead you about the actual market conditions. A sudden news event or economic announcement might cause volatility to spike unexpectedly, making older data less useful.
To stay informed and adjust your strategy quickly, use indicators like the VIX and watch price movements in real-time. This helps you react promptly to current conditions.
Takeaway: Always check real-time data before entering a trade to accurately assess market volatility.
Common Mistakes in Context Documentation
When recording market conditions and liquidity factors, traders often make mistakes that can lead to poor trading decisions. Here are some common errors to avoid:
- Ignoring Volatility Changes: Not updating volatility levels in your journal can result in overconfidence based on outdated data.
- Subjective Trend Identification: Mixing personal opinions with objective analysis, like assuming a trend will continue without solid technical indicators or chart patterns.
- Neglecting Liquidity Data: Overlooking trading volume and bid-ask spreads can mislead you about the best times to trade.
- Selective Data Recording: Only noting favorable conditions while ignoring unfavorable data creates bias, making it harder to accurately assess trades.
- Relying on Anecdotal Evidence: Using personal experiences instead of concrete market statistics and technical analysis signals leads to flawed decisions.
To avoid these pitfalls, make sure your documentation is objective and thorough. The information you log should reflect current market conditions without the influence of hindsight bias or emotions. How would your trading journal change if you followed this framework strictly?
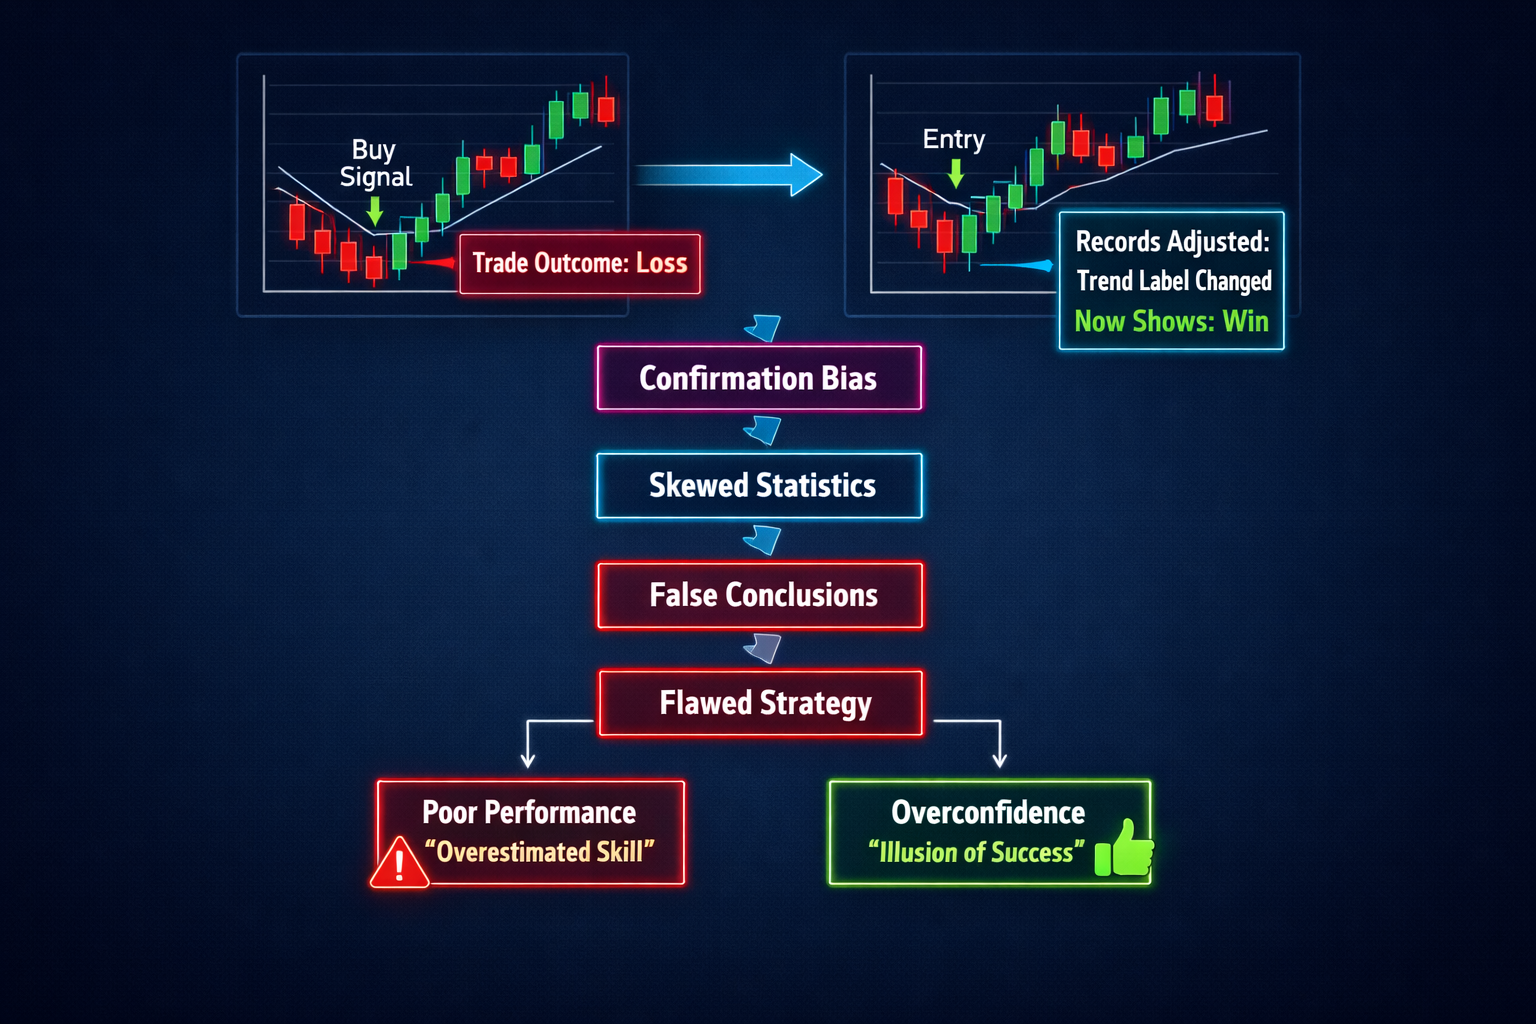
Adjusting Records Based on Trade Outcomes
To avoid hindsight bias and keep your market analysis objective, follow these key guidelines:
- Log the trend, range, and volatility before placing a trade.
- Don’t change these records after seeing the outcome of the trade.
- Document liquidity conditions at the time without altering them later.
Common Mistake: Adjusting trend classification from neutral to bullish after a profitable trade justifies positive results but introduces bias.
By sticking to pre-trade documentation, you ensure your market context remains objective and reliable for future decisions.
If you always adjust your notes after trades, how can you trust them when planning the next one?
Ignoring Objective Data for Subjective Judgments
Ignoring objective data in favor of subjective judgments can lead traders down a risky path. Relying too heavily on gut feelings or past experiences instead of current market conditions often results in poor decisions and increased risk. For example, if you base future trades on recent high-volatility successes without considering changes in the current market trends, you might end up making costly mistakes.
Here’s a comparison table to illustrate the difference:
| Aspect | Objective Data | Subjective Judgments |
|---|---|---|
| Reliability | Based on factual, verifiable metrics. | Often influenced by personal bias. |
| Consistency | Provides consistent information over time. | Varies widely based on mood or recent experiences. |
| Decision-Making | Guides traders with clear, actionable insights. | Can lead to inconsistent and unpredictable trades. |
Relying solely on subjective methods can cause you to miss important details such as current liquidity levels or sudden volatility spikes. To avoid this trap, it’s crucial for traders to document market context using objective data like technical indicators and price patterns.
How do you ensure your trading records are based on objective data rather than personal biases?
Practical Synthesis: A Context Recording Workflow
A recording workflow helps traders document market conditions accurately without falling into hindsight bias. This process blends technical analysis with liquidity factors to create an objective record.
Here’s how you can put it into practice:
- Identify Market Trends: Use indicators like moving averages or trend lines to figure out if the market is trending up, down, or sideways.
- Incorrect approach: Relying solely on intuition about whether the market will rise or fall.
- Why it fails: Intuitive methods can lead to inconsistent and unreliable assessments.
- Assess Liquidity Factors: Check trading volume and open interest to ensure there’s enough liquidity for effective trades.
- Evaluate Volatility Levels: Look at recent price movements to gauge volatility, which impacts trade execution and risk management.
- Document Trade Signals: Record technical signals that trigger buy or sell decisions based on predefined criteria as soon as they appear.
- Incorrect approach: Noting down signals only after the trade has been executed introduces bias.
By following these steps, your trading journal becomes a reliable tool for future reference and analysis. How will you apply these steps during your next trading session?
Introduction to Recording Market Conditions
Understanding market conditions is a critical aspect of trading, as it helps traders make informed decisions based on current and historical data. By analyzing market behavior in this guide, traders can identify trends, patterns, and potential opportunities that might not be evident otherwise.
- Learn to interpret market signals
- Understand the importance of technical analysis
Key Concepts in Higher-Level Trading
Higher-level trading concepts often involve a deeper understanding of chart patterns and metrics. These tools help traders filter through noise to find actionable signals as explained here, allowing them to make more precise entries and exits.
- Use technical analysis for better decision-making
- Identify key trading opportunities
The Importance of a Trading Journal
Maintaining a detailed trading journal is essential for tracking progress and improving performance. A well-structured journal can provide insights into past trades, helping traders refine their strategies over time according to this resource.
- Keep track of all trade details
- Analyze patterns in your trading behavior
Types of Chart Patterns
Different chart patterns offer unique insights into market dynamics. Learning to recognize these patterns can significantly enhance a trader’s ability to predict future price movements with this guide.
- Head and shoulders
- Double top/bottom
Objective vs. Subjective Data in Trading
It’s crucial to distinguish between objective data, which is factual and verifiable, and subjective data, which can be influenced by personal biases as discussed here.
- Use objective data for analysis
- Be aware of subjective influences
How to Apply with Flows Trading Journal
Using a trading journal effectively can greatly enhance your professional process. By logging detailed information before, during, and after each trade as outlined in this article, traders can gain valuable insights that improve future performance.
- Enhance your trading strategy
- Improve decision-making skills
Further Reading and Resources
For those looking to delve deeper into the world of market conditions and higher-level trading concepts, there are numerous resources available. Explore this comprehensive guide for more detailed information on maintaining an effective trading journal.
- Detailed guides and articles
- Interactive tools and calculators