How Journal Data Influences Risk Management Adjustments
Table of Contents
The Overlooked Value of Journal Data for Risk Management Adjustments
Imagine you’re a trader who has set rigid risk parameters but haven’t adjusted them based on recent trading experiences. One day, you notice an uptick in losses despite sticking to your original plan. This highlights why journal data is crucial: it provides real-time insights that static rules can’t.
Your journal captures every trade’s details – entry and exit points, market conditions at the time of execution – and reveals patterns and anomalies. If your journal shows consistent losses due to unexpected volatility spikes even with strict stop-loss orders in place, you might realize your risk parameters are too rigid for current market conditions.
Relying solely on unchanging risk rules without incorporating insights from ongoing trading activities can lead to suboptimal risk management and potential losses. Dynamic risk rules offer a more adaptive approach by leveraging journal data, ensuring your risk management stays relevant and effective in evolving markets.
Journal data transforms static guidelines into flexible frameworks that evolve with market conditions, reducing exposure to unnecessary risks and enhancing overall performance.
Limitations of Static Risk Rules
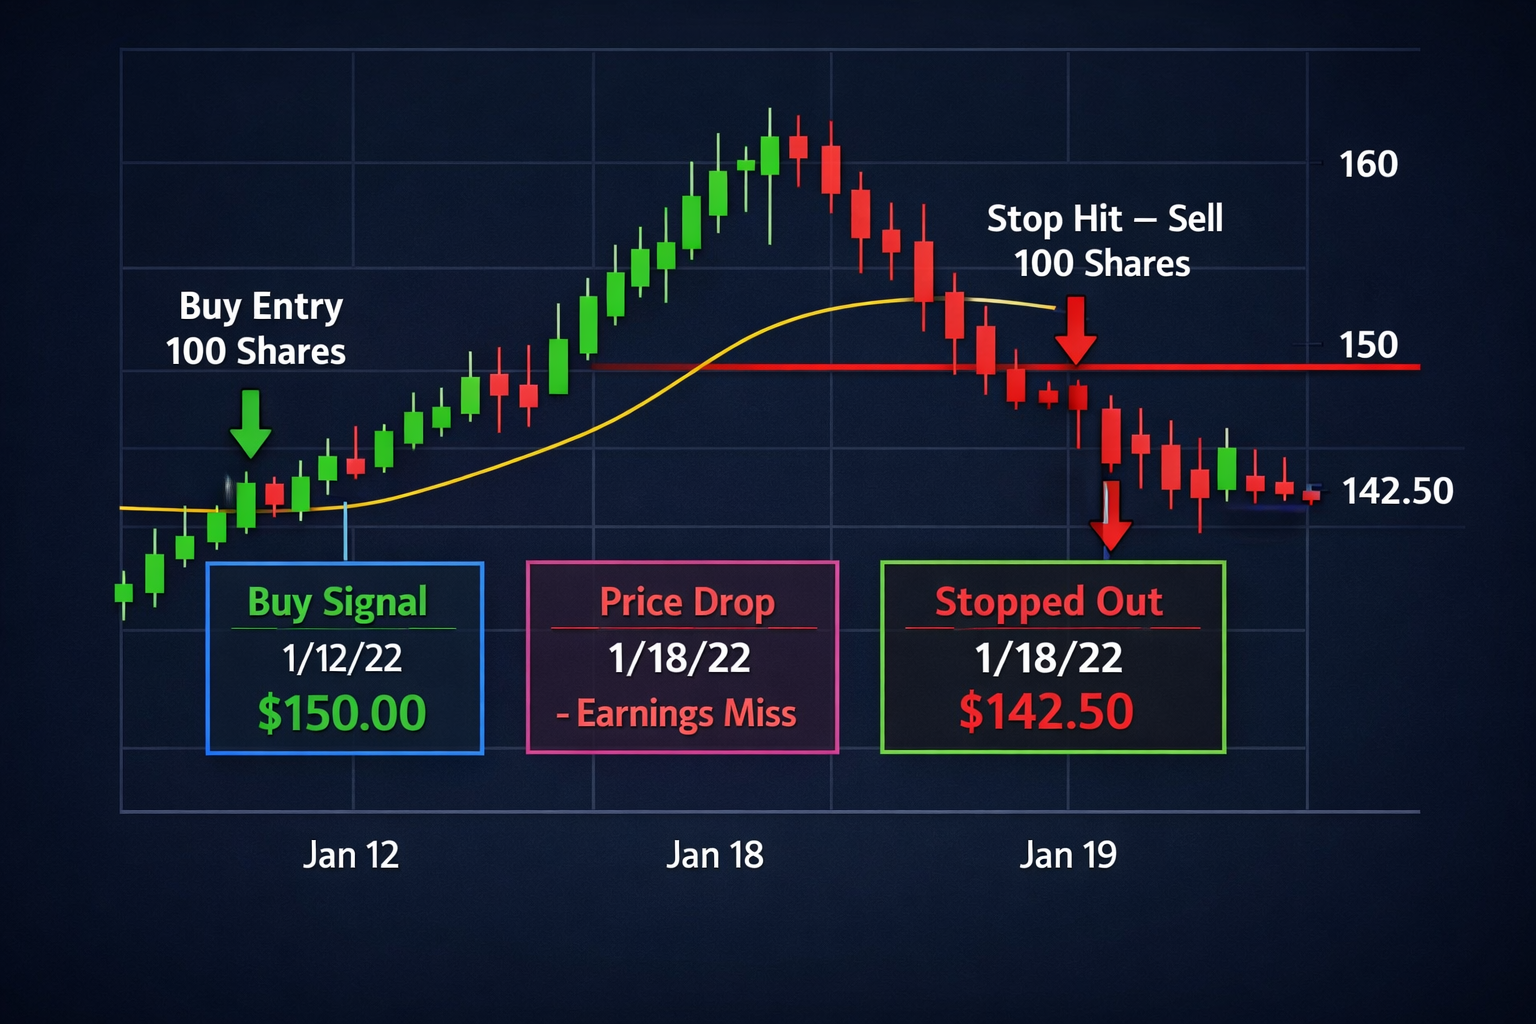
Rigid risk management rules can be harmful when market volatility shifts unexpectedly. For example, a fixed stop-loss level set at 2% of your account balance might work well in stable markets but leave you vulnerable during high-volatility periods.
Take Bitcoin as an example; it can swing by over 10% in a single day. If you have a static risk rule that limits losses to just 2% per trade, this could force premature exits and cause you to miss out on gains when the market stabilizes later.
To handle these risks better, traders should adjust their strategies based on recent market conditions noted in trading journals. This flexibility helps ensure that you’re not overly cautious during quiet periods or too aggressive when things get volatile, allowing you to navigate dynamic markets more effectively.
How will you adapt your static risk rules after reviewing your trading journal entries?
Practical Example of Using Trading Records
Alice had been trading for six months when she noticed her risk management wasn’t adapting to changing market conditions. By looking at her recent trades in her journal, she saw that out of 30 trades, half were profitable with an average gain of $200 per trade, while the other half lost about $180 each. Her current rule was set to cut losses at $150 to limit potential damage.
But when Alice dug deeper, she noticed her losing trades occurred during periods of high market volatility. She recalculated her average loss and saw it was actually $180 per trade. To account for this, she adjusted her risk parameter to a maximum of $200 per trade. If she hadn’t reviewed her journal, she might have stuck with the old rule and ended up losing more money during volatile times.
By tweaking her rules based on recent performance, Alice could better protect herself from big losses when markets got shaky. This shows how detailed trading data can highlight areas where you need to make adjustments in your strategies. To improve your own practices, review your trading records for similar patterns and make informed changes.
For more tips on refining your trading practices using journal entries, check out Professional Process Improvement.
Real-Time Insights Through Journal Analysis
Start by digging into your trading journal. Look for patterns that aren’t obvious from just looking at historical data.
Extract key metrics like win rate, average trade duration, and profit per trade to see how well your risk management is working based on recent trades. Compare today’s performance with yesterday’s entries to spot any discrepancies or anomalies that might need addressing.
Identify new trends that differ from the past. For example, if you notice increased short-term losses due to market volatility, tighten your stop-loss orders. Adjust your risk management rules: if high-frequency trading signals show heightened volatility, decrease position sizes or raise margin requirements right away.
Make these changes and monitor their impact over the next few days. Real-time adjustments help keep your risk management relevant to current conditions. By integrating journal analysis into daily assessments, you can proactively adapt strategies to mitigate risks and seize opportunities more effectively. What changes will you make today?
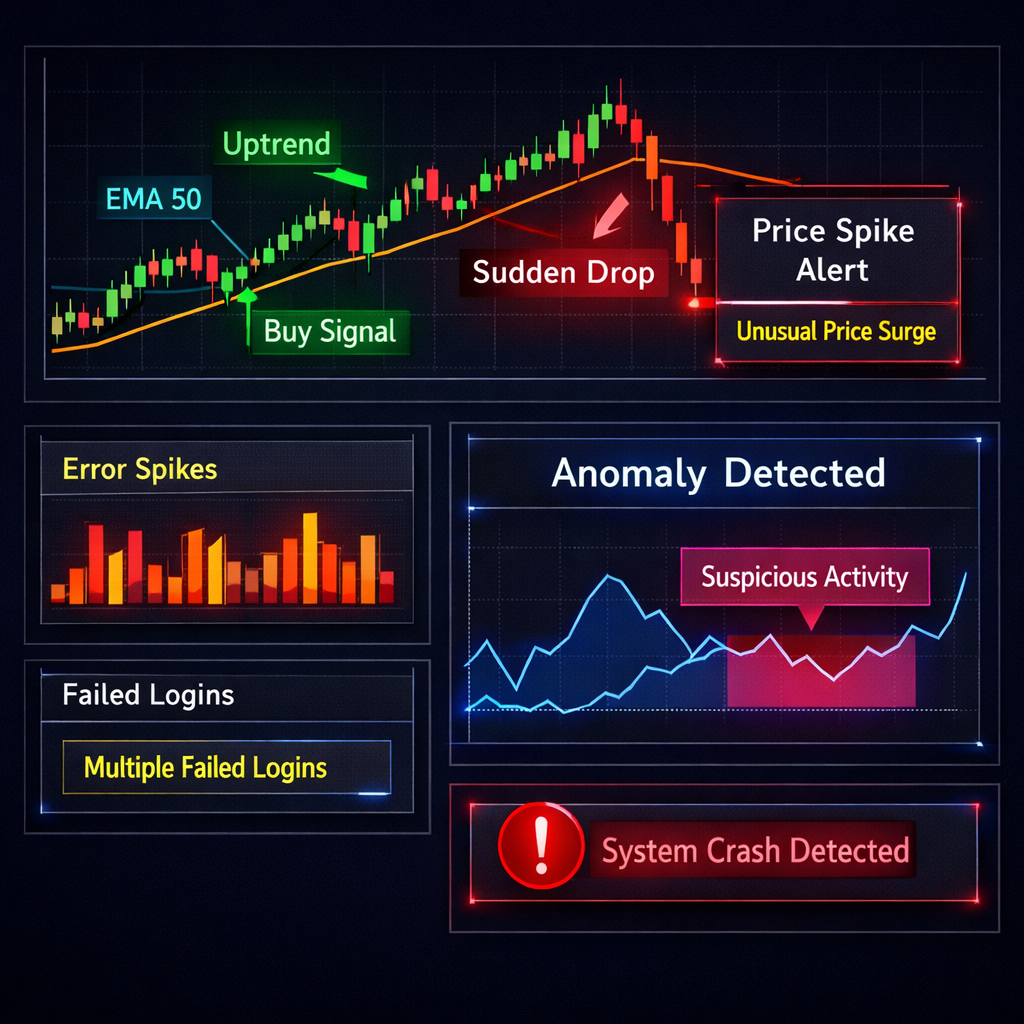
Spotting Trends and Anomalies in Real-Time
When analyzing real-time data, traders should look for trends and anomalies that help with risk management:
- Keep an eye on chart patterns like head and shoulders or double tops to spot potential reversals.
- Track moving averages to see when short-term and long-term lines cross, indicating shifts in market momentum.
- Watch volume changes for unusual spikes that show strong buying or selling pressure.
- Pay attention to price action for sudden spikes or drops that don’t fit the broader trend, as these can indicate anomalies.
- Use technical indicators like MACD and RSI to identify when markets are overbought or oversold.
Missing real-time data can mean missing out on opportunities. Staying current with trends is key for making timely risk adjustments.
To spot anomalies:
- Set up alerts on your trading platform when important indicators breach thresholds.
- Cross-check multiple sources to confirm unusual market movements.
- Keep a detailed journal to note unexpected events or patterns for further analysis.
Make it a habit to monitor real-time data daily to stay ahead of risks and opportunities.
Comparing Methods to Adjust Risk Limits
When beginners adjust risk limits, they often struggle with choosing between simple methods and complex statistical models. The key is using trading journals effectively to fine-tune your strategy. Let’s look at three practical approaches: manual adjustment based on journal data, automated rule-based systems, and expert advisory tools.
| Method | Effectiveness for Beginners | Flexibility | Ease of Use |
|---|---|---|---|
| Manual Adjustment | High | Very High | Medium |
| Automated Rule-Based Systems | Moderate | Low | High |
| Expert Advisory Tools | Low | High | Low |
Effectiveness for Beginners: Manual adjustment, based on personal journal analysis, works well because beginners can easily spot trends and anomalies in their trading records to refine risk parameters. Automated systems are harder to understand due to complex algorithms, while expert advisory tools tend to be overly complicated.
Flexibility: Manually adjusting your limits lets you incorporate unique insights from specific trades, making it very flexible compared to the rigid rules of automated systems or broad advice from expert tools.
Ease of Use: Automated rule-based systems are easiest to set up but offer limited customization options. Expert advisory tools require a lot of learning and consultation time.
Interpretation: Beginners should focus on manual adjustment, as it balances effectiveness with flexibility, allowing them to tailor risk limits based on their specific trading scenarios. For advanced users, integrating an automated system for initial setup followed by periodic manual reviews might work well.
To start refining your risk management today, review your recent trades and identify patterns suggesting a need for adjustments. Learn how journal data enhances risk monitoring to make informed decisions.
Common Mistakes in Using Journal Data
Common Mistakes in Using Journal Data
One common pitfall is not updating your risk settings based on the latest entries in your trading journal. If you stick to old performance metrics without considering current market conditions, your risk management might become ineffective.
For example, if you don’t tweak your risk parameters when markets get volatile, you could miss crucial signals that would help prevent losses during turbulent times.
Another mistake is ignoring unusual patterns or outliers in your journal data. Overlooking these anomalies can delay necessary adjustments and increase potential risks.
To stay on top of things, regularly review your trading journal entries to spot any new trends or issues early on.
Learn more about adjusting risk parameters.
How do you handle unusual patterns in your journal data?
Ignoring Real-Time Changes in Risk Adjustments
Ignoring real-time market changes can lead to big losses or missed opportunities. Instead of relying only on historical data, you should look at your trading journal entries regularly to adjust risk settings when needed.
For example, if a geopolitical event causes increased market volatility, a trader who doesn’t update their risk strategy might suffer significant financial hits or miss out on profitable trades. By reviewing and updating your approach based on current conditions recorded in your journal, you can better manage volatile markets.
Incorporating real-time insights into your risk management keeps your strategies effective. For more guidance, check out technical analysis to learn how to spot trends and anomalies.
Risks of Relying on Historical Patterns
Ignoring current market dynamics while relying solely on historical trading patterns can lead to significant risks:
- Misaligned Risk Parameters: Using old risk settings from calm markets in volatile conditions can result in premature exits or excessive risk-taking.
- Overreliance on Historical Data: Past trends may no longer be relevant due to changes like economic policies or geopolitical events, leading to misjudged entry and exit points.
- Inadequate Adaptation: Not updating your strategy based on recent journal entries means missing new patterns and warning signs important for improved risk management.
- Ignoring Real-Time Dynamics: Trading decisions need to consider current market conditions rather than historical averages. Real-time analysis helps in spotting anomalies and trends not evident in past data, reducing exposure to risks.
- Lack of Contextual Awareness: Historical patterns don’t account for unique events like economic crises or shifts in investor sentiment, leading to underestimated risks and overtrading.
Common Mistake: Failing to regularly update risk management rules based on recent trading experiences leaves you vulnerable. Always review your journal data periodically to adjust your strategy accordingly.
To stay ahead, analyze your latest trading records for emerging trends and anomalies that influence today’s risk adjustments. If you haven’t already, start a trading journal now to ensure it reflects the most current context for better decision-making. Start a trading journal now.
Applying Journal Data in Risk Management
To improve your risk management, take a look at your trading journal for patterns or anomalies that signal changing risks. For example, if a certain type of trade has been losing money consistently over the past month, make note of it.
Based on these trends, adjust your risk parameters accordingly. If high-risk trades are profitable, cautiously increase exposure but stay alert to potential changes in market conditions.
Create dynamic risk rules that adapt based on real-time journal data instead of sticking with static ones. Update thresholds and limits whenever significant trading patterns or market conditions change.
Regularly review journal entries to keep your risk management strategies up-to-date. Assess the impact of new trading signals if they appear frequently.
Use tools like chart pattern recognition along with your journal analysis to validate trends and confirm anomalies before making adjustments. This ensures well-informed, data-driven changes rather than speculative ones.
Integrate insights from your trading journals into your ISO 27001 or Basel Committee guidelines for risk management practices ISO 27001 Standards.
Failing to integrate real-time journal data can lead to outdated risk strategies and increase the likelihood of unexpected losses. Rigid rules without adaptation based on current insights can be harmful.
By regularly updating your risk parameters through journal analysis, you’ll maintain better control over trading outcomes. How will this approach change your current risk management strategy?
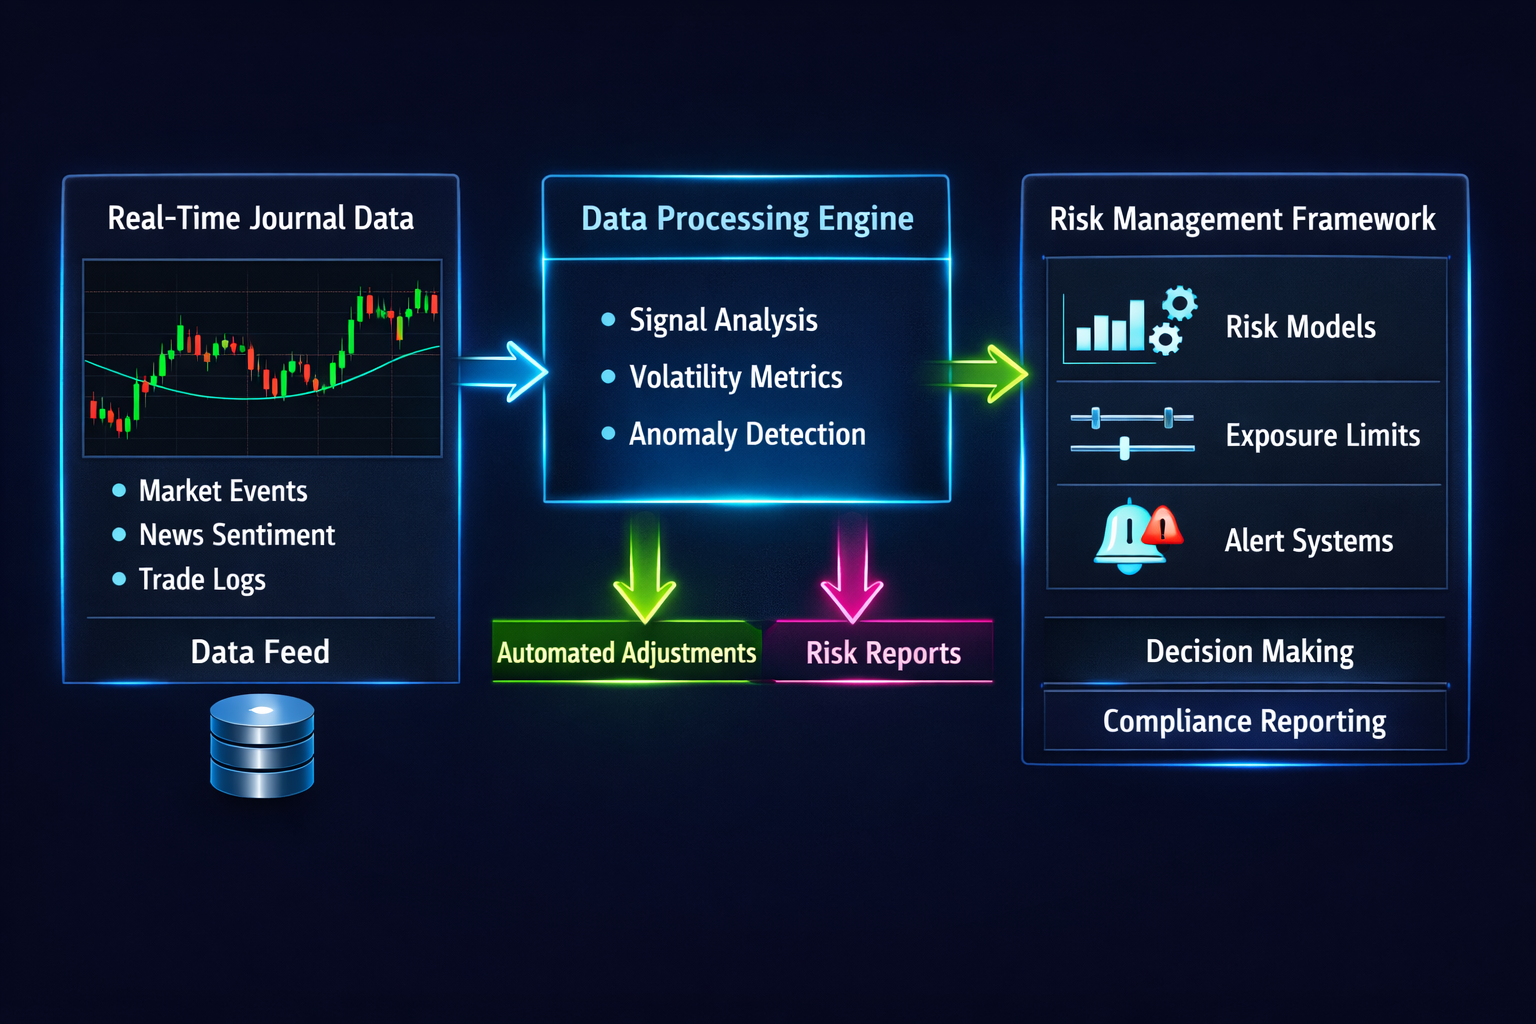
Integrating Real-Time Data with Existing Frameworks
Sarah has been trading for a decade and uses a reliable but static risk management system. Recently, her trading journal is showing significant shifts in market volatility and unusual price movements that her current setup isn’t catching.
To integrate real-time data from her journal without disrupting existing practices, Sarah follows these steps:
- Identify Key Indicators: She reviews her journal for patterns like increased market volatility and abnormal volume spikes.
- Set Up Alerts: Creates alerts to notify her when there are deviations from normal market conditions based on the key indicators she’s identified.
- Adjust Risk Parameters Incrementally: Makes small adjustments to risk limits and exposure constraints as new data comes in.
For instance, if Sarah notices erratic price movements, she might initially reduce position sizes by 10%, ensuring that any changes are manageable and reversible.
If she ignores real-time signals, her risk assessments could become outdated, leading to significant losses or missed opportunities.
By incrementally integrating real-time data, Sarah enhances her risk management without needing a full overhaul of her existing framework. This approach keeps traders agile while maintaining system reliability.
Best Trading Journals help record critical insights and ensure no market shift goes unnoticed.
Balancing Trader Autonomy and Risk Parameters
Balancing trader autonomy with risk management is key to success. Many traders struggle to make decisions that align with their analysis.
The table above shows two methods: fixed limits provide strong risk control but limit flexibility, often leading to poor adherence; flexible parameters informed by journal data offer more freedom while still maintaining a solid framework. For example, Alice uses real-time insights from her trading journal to adjust her strategy and find the right balance between independent decision-making and risk policies.
It’s important to integrate journal data into your decision-making process. Regularly review your entries for trends or anomalies that signal changes in market risks. If you notice losses due to overleveraging during specific times, tweak your parameters accordingly while keeping autonomy intact.
By using real-time data and adapting strategies dynamically, traders can effectively balance freedom with risk management. This approach helps improve performance and keeps risk policies relevant as the market environment evolves.
How do you manage this balance now? Share your experiences or ask questions below to refine this critical aspect of trading further.
Introduction to Linking Journal Data and Risk Management
In the fast-paced world of trading, maintaining a detailed journal is crucial for both beginners and experienced traders. A trading journal serves as an essential tool in risk management by providing insights into past trades, helping identify patterns, and improving decision-making processes. As explained in this comprehensive guide, a trading journal is more than just a record of transactions; it’s a critical component of professional growth and process improvement.
Related Articles
To enhance your understanding of the benefits and importance of maintaining a trading journal, consider exploring these related articles from Flows Trading Academy. These resources offer in-depth insights into various aspects of trading journals and their impact on professional development.
- How a Trading Journal Improves Your Professional Process
- Start a Trading Journal: A Beginner’s Guide
- Learn Different Types of Chart Patterns
Professional Growth Through Documentation
Documenting each trade meticulously can significantly enhance your professional process. As detailed in this article, keeping a thorough trading journal helps traders analyze their strategies, identify weaknesses, and refine their approach over time.
Getting Started with Trading Journals
For new traders looking to establish a solid foundation in the market, starting a trading journal is an excellent first step. This guide provides practical tips and advice on how to begin documenting your trades effectively.
Chart Pattern Recognition
Recognizing chart patterns is a fundamental aspect of technical analysis. Understanding these patterns can greatly enhance your ability to predict market movements accurately. For more information, see this detailed article on the importance of pattern recognition in trading.
Apply with Flows: Enhancing Trading Performance
At Flows Trading Academy, we believe that applying metrics and signals can significantly boost your trading performance. By leveraging the insights from metrics and trading signals, traders can make more informed decisions based on quantitative data rather than relying solely on intuition or guesswork.
Further Reading
To continue your learning journey and deepen your understanding of trading journals, technical analysis, and risk management, consider exploring these additional resources. Each link provides valuable insights into different aspects of trading that can help you refine your strategies and improve overall performance.
- Benefits of Keeping a Trading Journal
- Technical Analysis: Understanding Market Behavior Through Chart Patterns
Journaling Benefits
Discover the myriad benefits of keeping a trading journal, from improved risk management to enhanced performance. This article outlines several ways in which maintaining a detailed record can elevate your trading game.
Technical Analysis Insights
Dive deeper into the world of technical analysis by exploring this resource on understanding market behavior through chart patterns. This section provides a comprehensive overview of how to interpret various patterns and signals.