Seasonality is one of the most overlooked yet powerful concepts in trading.
While indicators show what is happening right now, seasonality reveals something different:
How the asset tends to behave at specific times of the year, historically.
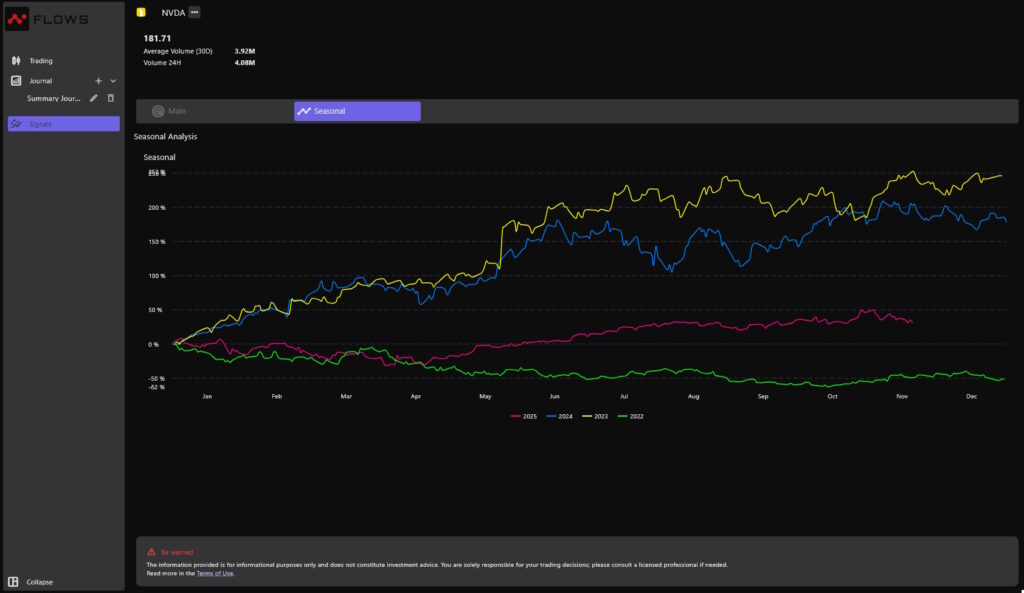
The Seasonal tab analyzes several years of price data and plots the average performance of the asset across the calendar year.
It helps you see patterns, tendencies, recurring strengths, and recurring risks—at a glance.
This page explains how to read the Seasonal view, why it matters, and how to integrate it into your trading.
What Seasonal Analysis Is #
Seasonality refers to recurring price behaviors that repeat year after year.
These patterns can be driven by:
Earnings cycles
Macro-economic cycles
Industry-specific cycles
Consumer behavior
Tax deadlines
Market psychology
Historical performance drivers
Not all assets have strong seasonality.
But when they do, it can provide incredible context.
Example:
Some tech stocks historically perform well in Q4 due to holiday spending.
Some commodities perform strongly in specific months due to supply/demand cycles.
Seasonality does not predict the future—but it reveals statistical tendencies that can help you make more informed decisions.
How the Seasonal Tab Works #
The Seasonal tab plots several past years of performance on a single chart.
Each line represents a complete year, normalized to percentage change from January 1st.
For example:
Yellow = 2023
Blue = 2024
Pink = 2025
Green = 2022
This lets you instantly compare:
How this year behaves vs. previous years
Whether the asset usually rises or falls during a period
If current performance deviates from the historical pattern
Whether seasonal strength or weakness is coming soon
The chart aligns all years on the same January-to-December timeline to highlight calendar-based patterns.
Why Seasonal Analysis Matters #
Seasonality provides context and confidence when making decisions.
✔️ 1. Identify High-Probability Periods #
Some assets historically:
Rally between March and June
Struggle in September
Surge in Q4
Dip during earnings cycles
If several years show the same pattern, it increases the probability of repetition.
✔️ 2. Spot Unusual Behavior #
If this year’s curve diverges from historical trends, something interesting is happening:
A macro shift
A major catalyst
A break from normal investor psychology
This can be a signal of opportunity or caution.
✔️ 3. Improve Timing #
Even if your technical analysis shows a bullish trend, seasonality tells you:
Whether it’s the right time of year to expect continuation
Whether a pullback is statistically common
Seasonality = timing intelligence.
✔️ 4. Strengthen Trade Validation #
You see:
Trend (Main tab)
Signal alignment (Indicators)
And now historical behavior (Seasonal)
When all three align:
Probability improves dramatically.
How to Read the Seasonal Chart #
Each colored line = one historical year #
They all start at 0% on January 1st, then show how that year progressed.
Key things to look for: #
1. Recurring patterns #
Do several years rise at the same time?
Do several years dip in September?
Is summer usually flat?
2. Outlier years #
If one year behaves very differently, was it due to:
A crash
Extraordinary news
Market shocks
Understanding outliers gives context.
3. Current year vs. history #
If the current year is:
Above historical curves → stronger-than-usual market
Below them → underperformance
In line → normal behavior
This adds meaning to today’s price action.
Practical Use Cases #
Scalpers #
Scalpers use seasonal analysis indirectly:
It helps identify high-volatility months
It warns about months with historically weak movement
This lets scalpers adjust expectations and risk.
Day Traders #
Day traders can:
Focus on trending periods
Avoid historically choppy zones
Understand context behind recent volatility
Example:
If an asset historically performs poorly in September, day traders can be more conservative.
Swing Traders #
Swing traders benefit massively:
Seasonal strength improves trend-trading probability
Seasonal weakness warns of upcoming pullbacks
Helps avoid swing entries during historically flat months
Example:
If NVDA historically rallies from March to June, swing traders focus long entries during that period.
Investors #
Long-term investors use seasonality to:
Accumulate during historically weak months
Add aggressively in historically strong quarters
Compare multi-year performance for trend health
Seasonality becomes part of macro timing.
Example Scenarios #
Example 1 — Strong Spring Seasonality #
If 2022, 2023, and 2024 all show a strong uptrend between March and June:
Consider long setups with extra confidence
Watch for early signals in late February
Expect volatility and opportunity
Example 2 — Repeated September Weakness #
If every year dips in September:
Avoid aggressive entries
Tighten stops
Prepare for cheaper prices
Expect quieter growth
Example 3 — Current Year Breaking Pattern #
If the current year suddenly outperforms historical curves:
A new catalyst may be in play
Trend may be stronger than usual
Consider leaning into momentum (with risk management)
If the current year underperforms:
A structural weakness or external event is suppressing the stock
Be cautious with bullish setups
How to Combine Seasonal + Technical Signals #
Seasonality + Signals = Smart timing + Strong confirmation.
Best Use Cases: #
Find seasonal strength → verify signals in the Main tab
See seasonal weakness → wait for stronger confirmation before buying
Identify periods where technical signals are more reliable
Anticipate when trend signals may gain strength
Avoid risky trades during historically flat or choppy periods
Example:
Seasonal: “Historically bullish in June”
Main tab: Trend + momentum turning bullish
→ High-probability long setup
⚠️ Important Reminder #
Seasonality provides historical tendencies, not predictions.
Always combine seasonal data with:
Signals
Chart structure
Volume
Volatility
Risk management
It is a context tool, not a certainty tool.
Final Thoughts #
The Seasonal tab gives you:
A unique view of yearly behavior
Context that most traders completely ignore
Better timing
Better trade filtering
More confidence when signals align
Use it to understand how the asset behaves through the year, not just how it behaves today.


