Built-in indicators are great, but at some point most serious traders hit a limit:
You want to combine multiple signals into one tool.
You want to adapt a public idea to your own rules.
You’ve developed a personal way of reading price that no standard indicator reflects.
That’s where custom indicators come in.
In Flows.Trading, a custom indicator is simply JavaScript code that reads candles, performs calculations, and draws on the chart using a dedicated API.
You are free to:
Implement your own logic (trend, structure, Smart Money concepts, volatility filters, etc.)
Reproduce indicators you’ve seen elsewhere
Build fully proprietary tools that exist only in your environment
The scripting engine is JavaScript-based, so if you know basic JS (variables, arrays, loops, functions), you’re already most of the way there.
2. The Custom Indicator Editor #
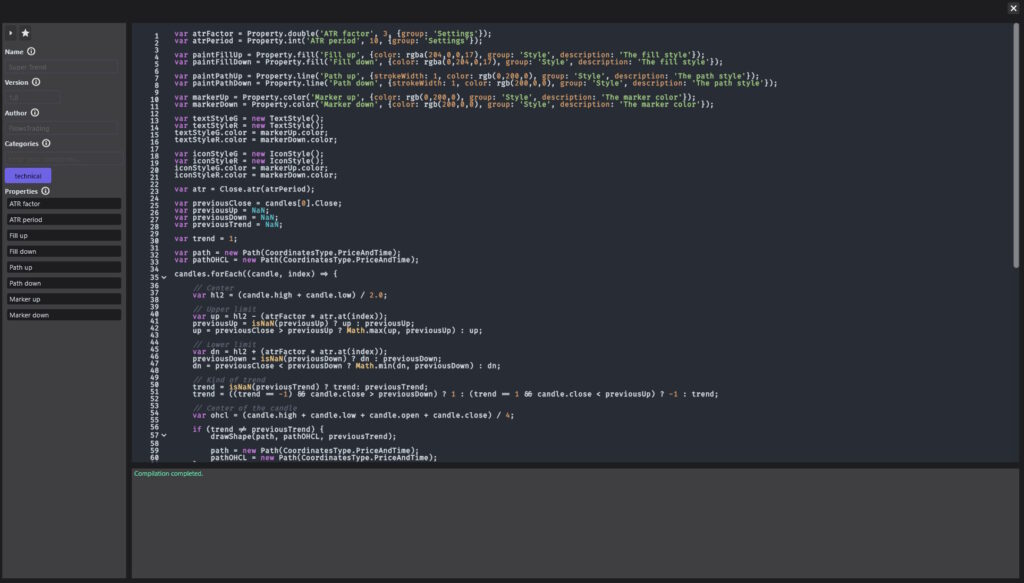
When you click “New…” or open an existing custom indicator, the code editor appears (as in your screenshot).
It is made of several key areas:
Compile button (
>):
Runs and validates your code. The indicator is only updated on the chart after a successful compile.Favorite toggle (⭐):
Marks the indicator as a favorite so it appears quickly in filtered lists.Metadata panel (left side):
Name – the indicator’s display name
Short Name – optional compact label
Version – your internal version number
Author – usually prefilled (e.g. FlowsTrading or your username)
Categories – tags like
technical,oscillator,volatility,structureto help filteringProperties list – the user-facing settings you expose (e.g. “ATR period”, “Color up”, etc.)
JavaScript code area (center):
Where indicator logic is written. This is a standard JS environment with additional built-in classes and functions.
The usual workflow:
- Edit code
- Click
>Compile - Fix any errors (if needed)
- Once compilation succeeds, attach the indicator to a chart via the indicator list (
+button)
3. Core Data Model #
3.1 Candles #
Your script runs with access to a list of candles:
timestampopen,high,low,closevolumeisBull
This is the raw data your indicator will work on.
3.2 DataFrames – Working With Series #
Indicators typically operate on time series (one value per candle).
In Flows.Trading these series are represented by the DataFrame type.
A DataFrame lets you:
Store and iterate over values
Perform arithmetic (
+,-,*,/) with constants or other seriesApply rolling functions (sum, averages, highest/lowest, etc.)
Compute classic TA series (EMA, SMA, WMA, RMA, RSI, ATR, True Range…)
Detect structure (pivot highs/lows)
Common predefined series:
Close– close prices for all candlesOpen– open pricesHigh– highsLow– lows
Examples of what you can express:
Close.ema(20)– 20-period exponential moving average of closing pricesClose.rsi(14)– RSI(14) based on closesHigh.highest(50)– highest high over the last 50 barsClose.change(1)– bar-to-bar change
You can combine these series with arithmetic or your own logic to build more advanced indicators.
4. Styling and Coordinates #
Your indicator can draw lines, shapes, areas, text, histograms and icons on the chart.
4.1 Coordinate Types #
Two coordinate systems are available:
PriceAndTime– coordinates are given in chart units (timestamp + price).
Use this for anything that must follow price and time, like moving averages or bands.Screen– coordinates are given in screen pixels.
Use this for overlay elements that should not scale with the chart (fixed labels, HUD-style elements).
4.2 Style Classes #
To control appearance, the API provides several style classes:
PaintLine or fill style (stroke width, color)
Used for paths, lines, rectangles, fills, histograms
TextStyleText color, font size, bold/italic
Used with text drawing functions
IconStyleIcon color and size
Used when drawing icons
OffsetOptional x/y adjustment relative to a base coordinate
Useful to avoid overlapping labels or shift text slightly away from the bar
You create an instance, customize its fields (e.g. color, thickness), then pass it to the drawing functions.
4.3 Icons #
The Icons collection exposes a set of prebuilt icon codepoints:
Directional arrows (up/down/left/right)
Alternate arrows
Shapes (star, circle, square, cross)
Symbols (target, rocket, heart, lightbulb, hourglass, etc.)
You use these when calling drawIcon to display visual signals on the chart.
5. Paths & Histograms #
Some visual elements are more complex than a simple line.
5.1 Path #
A Path represents a sequence of points:
Can be built in screen or price/time coordinates
You can append points manually (
add(x, y)) or build directly from aDataFrame(one point per candle)
Use with:
drawPath(paint, path)– draw the linedrawFill(paint, path)– fill the area inside the path
Typical use cases:
Moving average lines
Bands and envelopes
Custom shapes following price
5.2 Histogram #
A Histogram represents a series of vertical bars:
Each bar has a position (usually time), height, and optional color
Works well for volume-like or oscillator-style plots
Use with:
drawHistogram(paint, histogram)
6. Drawing Functions #
Once you’ve computed what you want to display, you use drawing functions to render it on the chart.
Internally they send messages to the platform — you only need to call them with the right parameters.
The main functions are:
drawLine(paint, x1, y1, x2, y2, offset1?, offset2?)
Draws a straight line between two points.drawPath(paint, path)
Draws a multi-point path (lines connecting each point).drawFill(paint, path)
Fills the area inside a path.drawHistogram(paint, histogram)
Draws vertical bars (e.g. for volume or custom bar-style plots).drawHLine(paint, y)
Draws a horizontal line at a specific price level.drawRectangle(paint, x1, y1, x2, y2, offset1?, offset2?)
Draws a rectangle between two coordinates.drawTextAt(textStyle, x, y, text, offset?)
Renders text at a specified coordinate.drawIcon(x, y, codepoint, iconStyle?, offset?)
Draws an icon using a symbol from theIconsset.
For anything that should follow price/time, pass coordinates in PriceAndTime; for overlays, use Screen.
7. Properties – Making Your Indicator Configurable #
You rarely want an indicator to be “hard-coded”. Periods, colors, and switches should be adjustable by the user.
That’s the role of the Property helper.
Each static method on Property:
- Declares a property (with a name, default value, and optional group/description).
- Returns its current value (either default or user-defined).
Supported property types include:
Property.bool(name, defaultValue, options)For ON/OFF toggles.
Options:
group,description.
Property.int(name, defaultValue, options)For integer inputs (periods, lengths…).
Options:
group,description,min,max.
Property.double(name, defaultValue, options)For floating-point values (factors, sensitivities).
Property.string(name, defaultValue, options)For free-text values or dropdown selectors (when combined with UI support).
Property.options(name, defaultValue, optionsArray, options)For predefined option sets (e.g. mode: “Fast / Normal / Slow”).
Property.line(name, styleOptions)Returns a
Paintconfigured for line drawing.styleOptions:strokeWidth,color,group,description.
Property.fill(name, styleOptions)/Property.color(name, styleOptions)Returns a
Paintfor filled areas or colors.
Example of usage (conceptual):
“Fast length” (integer, Settings group)
“Show signals” (boolean, Visibility group)
“Up color” / “Down color” (line/fill properties, Style group)
These appear automatically in the indicator’s Properties UI and in the editor sidebar under Properties.
8. High-Level Example (Conceptual) #
A typical custom indicator script will:
- Declare properties for lengths, styles, and options.
- Read price data from
Close,High,Low, etc. as DataFrames. - Apply transformations (EMA, ATR, RSI, highest/lowest, etc.).
- Prepare style objects (Paint, TextStyle, IconStyle).
- Build shapes (Paths, Histograms) representing the indicator.
- Draw them on the chart with
drawPath,drawFill,drawTextAt,drawIcon, etc.
For example:
Compute a custom trend line from
Close.ema(20)andClose.ema(50).Draw both EMAs using
Path.fromDataFrameanddrawPath.Detect crossovers and plot icons on the candles where they occur.
Expose lengths and colors as
Property.int/Property.lineso you can tune them from the UI.
You decide how simple or complex the logic becomes.
9. Best Practices #
Start simple. Begin with a moving average variant or a basic signal before building complex models.
Expose properties. Don’t hardcode everything — make the indicator adaptable.
Keep performance in mind. Avoid unnecessary loops; prefer
DataFramemethods when possible.Document your code. Comment your logic so future you understands what each block does.
Test across markets and timeframes. Indicators can behave differently in FX, crypto, stocks, or low-liquidity assets.
10. Summary #
Custom indicators in Flows.Trading let you:
Work directly with candle data through high-level DataFrame utilities
Draw rich visual output via paths, histograms, text, and icons
Style everything using Paint, TextStyle, IconStyle, Icons, Offset
Expose flexible properties for user customization
Use familiar JavaScript syntax for logic and control flow
They are the bridge between your trading ideas and a living, visual implementation on the chart.
If you want, I can now write a short “Build your first indicator” tutorial that walks step-by-step through creating a simple custom script using this API.


