Technical analysis isn’t just a method — it’s a language. It’s the way traders read the story that markets constantly tell: who is in control, where liquidity sits, where participants are trapped, and where price is likely to move next.
At its core, technical analysis answers the single most important question:
“Where is the market creating opportunity?”
Numbers, indicators, and patterns aren’t random. They reflect collective human behavior — fear, greed, impatience, euphoria, capitulation. And because human behavior tends to repeat, markets form recurring structures.
Recognizing these structures gives you an edge.
Why traders rely on technical analysis #
Before diving into tools or patterns, it’s important to understand why technical analysis is so widely used.
At its core, technical analysis gives traders a way to interpret the constant push and pull of the market — not as random movement, but as the visible expression of supply, demand, and crowd psychology.
Every candle tells a story: who is in control, where liquidity sits, and how participants react to different price levels.
By learning to read these patterns, traders gain a clearer sense of structure, opportunity, and timing.
Put simply, technical analysis turns price action into information you can act on.
Technical analysis helps you:
Understand market psychology. Every candle reveals intention: absorption, rejection, imbalance, strength, weakness.
Identify high-probability zones. Support/resistance, liquidity pools, supply & demand, order blocks.
Time entries with precision. Price action gives the “when”, not just the “what”.
See opportunities others miss. Liquidity sweeps, mitigation moves, displacement — these are invisible without a trained eye.
Manage risk scientifically. TA lets you define stops, targets, and position sizes with objective levels.
Build consistency. Once you understand the structure, your reactions become systematic instead of emotional.
Even if you trade fundamentals, macro, or news, technical analysis tells you when to act… not just what to act on.
The bigger picture #
In a world where markets move 24/7 and volatility is constant, technical analysis becomes your map.
Without it, you’re navigating in the dark.
With it, you see patterns that repeat across all timeframes and assets — from crypto to stocks to commodities.
Technical analysis is not about predicting the future with certainty.
It is about stacking probabilities in your favor, over and over again.
And this is exactly what Flows.Trading enables:
A space where you can express your trading logic visually, clearly, and with precision.
1. The Drawing Workflow — Turning Observations Into Insights #
Every drawing tool in Flows.Trading follows the same philosophy:
Choose a tool → click or drag on the chart → express your trading idea visually.
It is intentionally simple, but incredibly powerful.
Behind this gesture is the foundation of structured analysis:
A trendline is not just a line — it expresses how you see structure evolving.
A rectangle is not just a shape — it marks zones where you expect liquidity or reactions.
A Fibonacci retracement is not decoration — it’s a hypothesis about where price may pull back.
A long/short position tool is not a graphic — it’s your risk management plan made visible.
Each drawing you place on the chart represents a piece of your thinking.
Over time, your chart becomes a mirror of your strategy, revealing exactly why you took a trade, where your bias changed, or where structure broke.
This is why mastering drawing tools is a critical step in becoming a more intentional and consistent trader.
2. Anchor Points — Where Precision Happens #
Every drawing object you place on the chart includes anchor points:
small red squares or circles that appear when the drawing is selected.
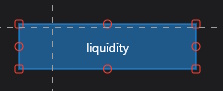
These anchors give you total control over your analysis:
Move the object #
Drag any anchor to reposition the drawing exactly where you want it.
Resize or reshape #
Many tools have multiple anchors — for example:
A rectangle has four corners.
A trendline has two points.
A Fibonacci retracement has two swing points.
A pitchfork has three key anchors.
Modifying anchors updates the drawing dynamically, letting you refine analysis as structure unfolds.
Select and manage drawings easily #
Click any anchor → selects the drawing.
Press Delete → instantly remove the selected object.
Hold Shift → select multiple drawings together.
Anchor points make your analysis adaptable.
Instead of deleting and redrawing tools, you refine them as conditions evolve — just like professional traders do.
3. Drawing Properties — Style, Clarity, and Your Personal Visual Language #
When you select a drawing, a top toolbar appears above the chart.
![]()
This toolbar gives you immediate access to the most important visual settings:
Color
Line thickness
Opacity
Visibility toggle
Template selection
Lock/unlock
Delete
These options allow you to quickly shape the look of your drawings without interrupting your workflow.
Each drawing tool comes with its own set of properties.
Some tools only include visual settings—such as color, opacity, borders, or labels—while others also include analytical or mathematical parameters, like Fibonacci ratios, Gann levels, volume-profile ranges, or calculated projection rules.
The Properties panel automatically adapts to the selected tool, displaying only the options that make sense for that specific drawing.
This keeps the interface clean while giving you precise control over each object you place on the chart.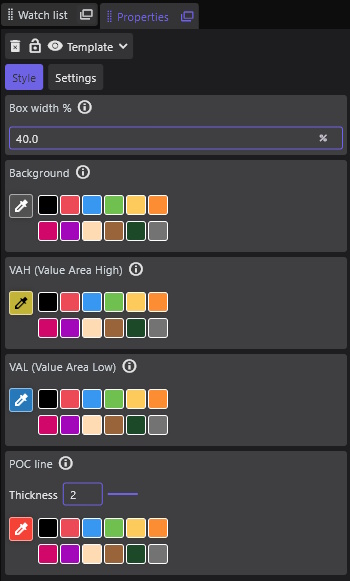
This helps you build a consistent visual language for your trading style.
Clear visuals lead to clear decisions — especially when analyzing complex structures.
4. Templates — Build Your Own Analysis Toolkit #
Different traders have different visual systems.
A Smart Money Concepts trader might use:
Blue rectangles → liquidity zones
Red rectangles → bearish order blocks
Green rectangles → bullish order blocks
A Fibonacci-based swing trader might use:
Custom-colored retracement levels
Specific extensions for targets
Preconfigured channels
A trend trader may rely on:
Clean white trendlines
Highlighted breakout levels
Color-coded multi-timeframe zones
Instead of restyling drawings each time, you can save any drawing as a template:
- Select a drawing with the style you like
- Open the Template menu
- Click Save as template…
- Name it (e.g., “OB Bullish”, “Liquidity Zone”, “Fib Setup A”)
Now you can apply it instantly whenever needed:
Template → [Name]
Templates make your workflow faster, cleaner, and more consistent — especially when applying repeating patterns like order blocks or market structure zones.
5. Managing Drawings — Control, Order, and Focus #
As you build your analysis, the chart can accumulate many drawings.
Flows.Trading gives you global controls to stay organized:
Delete all drawings #
Clear the entire chart when starting a fresh analysis.
Show/Hide all drawings #
Hide annotations to re-evaluate price action without bias.
Lock/Unlock all drawings #
Prevent accidental moves during important analysis or during active trades.
These tools are essential when backtesting, journaling, or refining strategy.
6. Context Menu — Fast Actions for Power Users #
Right-click any drawing to open its context menu, offering:
Duplicate
Delete
Style settings
Send to back / bring to front
Convert to template
Lock / Unlock
Hide / Unhide
This menu keeps advanced options accessible without navigating through panels.
7. The Technical Analysis Toolkit – All Tools, With Real Use Cases #
All tools live in the left-hand toolbar of the Charting Space.
They’re grouped visually, but they all follow the same pattern:
Pick the tool → click or drag on the chart → refine using anchor points and properties.
Below is a guided tour of each family of tools and what traders actually use them for.
7.1 Core Interaction #
Selection Tool #
The selection tool is your “default cursor” for working with drawings.
Click a drawing to select it, move it, or access its anchors.
Drag to move the whole object.
Use it to switch from “drawing mode” back to “interaction mode”.
When to use it:
Always. Think of it as your “home base” between two actions.
7.2 Structure & Zone Tools (Rectangles, Lines, Shapes) #
These tools are the foundation of visual market structure.
Rectangle & Square #
Draw boxes around important price areas:
Liquidity pools
Supply/demand zones
Consolidation ranges
Order blocks (bullish/bearish)
A square is just a constrained rectangle when you want equal height/width.
Why it matters:
Modern approaches like Smart Money Concepts rely heavily on clearly marked zones. Rectangles give those ideas a clean visual presence.
Line #
Basic trendline between two points:
Connect swing lows in an uptrend
Connect swing highs in a downtrend
Extend to project future reactions
Use it to:
Define market direction, trend strength, and potential breakout levels.
Horizontal Line #
Places a level across the entire chart at a specific price:
Support / resistance
Key psychological round numbers
Previous highs/lows
Session opens/closes
Why traders love it:
Horizontal levels are often where decisions are made: entries, stops, take-profit zones.
Vertical Line #
Draws a time marker at a specific candle:
Mark news events
Highlight entry/exit times
Separate sessions or days
Use as “before/after” markers in journaling
Great for journaling:
Helps you review what you saw and did at a specific moment.
Path #
A free-form connected line:
Sketch likely price paths (“if price does this, I expect that…”)
Map hypothetical scenarios
Illustrate training examples or educational notes
Use it when:
You want to visualize possible future structure rather than just historical structure.
Parallel Lines #
Two or more lines that keep the same distance from each other:
Define trend channels
Create equal-range expansion zones
Frame price swings symmetrically
Why it matters:
Parallel structures help you see when price is respecting a channel or when it’s breaking away.
Triangle #
Draw a three-point shape:
Symmetrical triangles
Ascending/descending triangles
Pattern-based breakout setups
Useful for:
Classical chart patterns and breakout strategies.
Disk / Circle #
Draw a circular highlight around something:
Highlight key reaction candles
Mark important wicks or imbalance areas
Draw attention to a specific point for teaching or review
7.3 Fibonacci & Advanced Geometry #
These tools help you quantify moves and project potential turning points.
Fibonacci Retracement #
Draw from a swing low to a swing high (or vice versa):
Identify pullback levels (e.g., 38.2%, 50%, 61.8%)
Combine with structure: confluence with zones or moving averages
Plan entries around key retracement levels
Typical use:
“In a bullish move, where could a healthy pullback stop before trend continuation?”
Fibonacci Extension #
Extends beyond the original move to project targets:
1.272, 1.618, 2.0 extensions for profit-taking
Harmonic pattern validation
Measure the strength of expansions
Use it to:
Set logical, structured take-profit zones instead of arbitrary targets.
Fibonacci Channel #
Combines channeling and Fibonacci proportions:
Draw a base trendline then parallel lines at Fib ratios
Visualize expansions and compressions within a trend
Spot where price frequently reacts relative to the trend
Gann Fan #
Angular tool with lines projecting from a key pivot:
Based on Gann’s time/price balance concepts
Shows potential dynamic support/resistance at specific angles
Gann Box #
A box divided into time/price proportions:
Used to study how price reacts at important time/price intersections
Often used by geometric/astro/advanced technical traders
Note: These tools are for more advanced styles; you don’t need them on day one, but they’re there when you grow into them.
Andrew’s Pitchfork #
Three-point tool (pivot high/low, then opposite swing):
Creates a central median line with two parallel outer lines
Used to project trend channels and mean reversion zones
Helps see how price oscillates around a “fair value” path
Volume Profile #
Plots traded volume by price level rather than time:
Shows where most trading activity occurred (high volume nodes)
Highlights low-volume “gaps” where price may move quickly
Helps find fair value areas vs. areas of rejection
Powerful for:
Contextualizing support/resistance with actual traded activity, not just price.
7.4 Trade Planning Tools #
These are not just drawings — they are risk management tools.
Long Position Tool #
Visual representation of a long trade:
You set entry, stop-loss, and target on the chart.
The tool automatically shows risk-reward ratio, P&L, and position size (based on your settings).
Use it to:
Plan trades before execution.
Document trade ideas in your journal.
Communicate setups with precise, visual parameters.
Short Position Tool #
Same as above, but for short trades:
Entry above, target below.
Visually inverts the risk/reward layout for bearish setups.
Measure Tool #
Click-drag between two points:
Shows price change (absolute), percentage change, and bar count.
Perfect for measuring swing size, volatility, or move duration.
7.5 Text, Notes & Communication #
Charts are for thinking — and thinking often requires words.
Text #
Simple text block:
Notes to self
Mark sessions, rules, or reminders
Explain context to future you
Text Callout #
Text plus a pointer line:
Annotate specific candles or zones
Explain why a particular level matters
Create educational charts for others
Price Callout #
Anchored text connected to a price level:
Label “break-even”, “previous high”, “weekly open”, etc.
Highlight key levels in a more structured way than plain text.
Comment #
A more narrative note:
Ideal for journaling thoughts: “why I took this trade”, “what I missed”.
Use with Replay or your Journal Space for deep performance review.
Arrow & Arrow Mark #
Pointing tools:
Mark breakouts, fake-outs, or reaction candles.
Show the expected direction of a move.
Visually emphasize key bars during review.
Icon #
Drop visual symbols (stars, flags, custom icons):
Tag high-quality setups
Mark “A+ trades”, “mistakes”, “needs review”
Build your own visual tagging system
7.6 Global Controls #
Finally, tools that affect all drawings at once:
Delete All Drawings #
Removes every drawing from the current chart.
Use when: starting a fresh analysis, cleaning the chart after a session, or preparing screenshots.
Show / Hide All Drawings #
Toggle between a clean price-only chart and your full annotated view.
Great for:
Checking if your bias is influenced by over-drawing
Comparing “raw price” vs. “interpreted price”
Lock / Unlock All Drawings #
Freeze or unfreeze everything.
When locked: you can’t accidentally drag or modify objects.
Ideal when trading live and you don’t want to disturb your carefully drawn levels.
7.7 Putting It All Together – A Typical Analysis Flow #
- Mark structure
- Use lines, horizontal levels, rectangles to define trend and zones.
- Add precision tools
- Use Fibonacci, Pitchfork, or channels for confluence.
- Plan your trade
- Drop a long/short position tool, adjust entry/stop/target until the risk-reward fits your rules.
- Annotate your thinking
- Use text, callouts, and arrows to explain why.
- Template & lock
- Save reusable configurations as templates.
- Lock drawings once the plan is set.
- Review & learn
- After the fact, use comments and icons to mark what worked and what didn’t.
This is how technical analysis becomes more than drawing lines:
it becomes a repeatable decision framework, fully supported by Flows.Trading’s toolkit.


