Every chart in Flows.Trading follows a clear and consistent structure designed to balance visibility, speed, and control.
Once you understand how the chart window is organized, navigating the platform becomes instinctive — you’ll know exactly where to find every tool, panel, and control.
Think of the chart window as your trading cockpit: everything you need for market analysis, execution, and tracking is within reach.
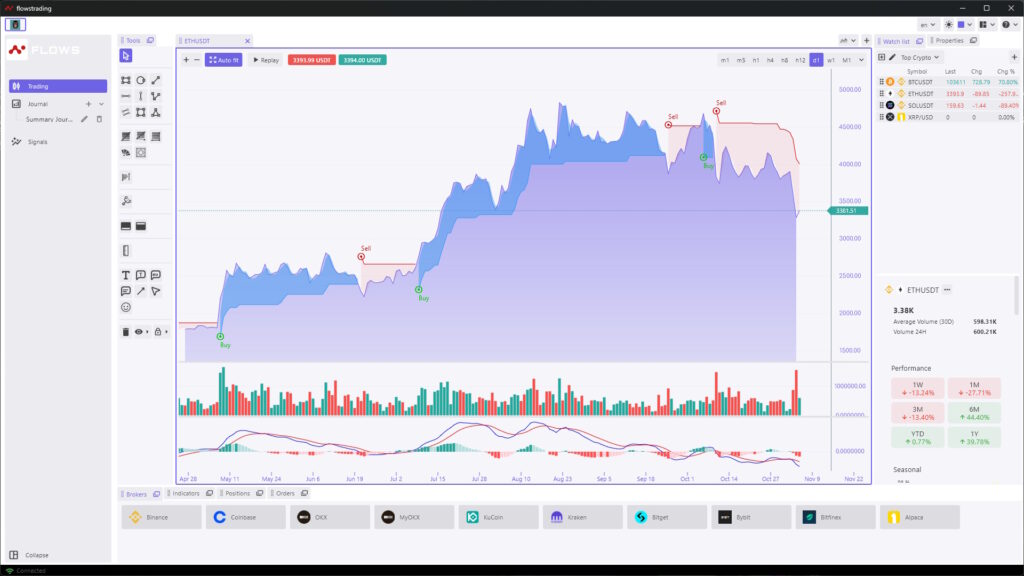
Below is an overview of each major area within the Charting & Trading interface.
From top to bottom and left to right, here’s how the layout is organized:
1. Top Bar — Symbol & Time Controls #
Located at the top of the chart, this bar manages market selection and time control.
Includes:
Symbol selector: choose or switch trading pairs (e.g., ETHUSDT).
Auto Fit: automatically re-centers and scales the chart.
Replay mode: view and replay historical data.
Live price badges: display the latest bid/ask or mark price.
Timeframe selector: switch between intervals (1m, 5m, 1h, 1D, etc.).
💡 Tip: Use the top bar to switch markets or adjust perspective instantly — for example, jump from the 15-minute view to the daily chart to confirm long-term trend direction.
2. Left Toolbar — Drawing & Annotation Tools #
The vertical toolbar on the left gives you quick access to all visual analysis tools.
These are your manual, interactive tools, perfect for mapping market structure or planning trade ideas.
Typical tools include:
Selection and cursor modes
Trendlines, channels, and rays
Fibonacci retracements and extensions
Shapes and zones
Text notes, labels, arrows, and measurement tools
Erase, undo, and redo controls
💡 Tip: Hover over any icon to see its tooltip and shortcut — a great way to learn the toolkit by exploration.
3. Center Area — Price Pane #
This is the core of the workspace, where price action is displayed.
You can visualize different chart types (candles, bars, lines, areas) and overlay indicators or drawings directly.
Features:
Zoom or scroll with mouse wheel or touchpad.
Drag vertically or horizontally to adjust the scale.
Right-click for quick options (add indicator, hide drawings, switch chart type).
Most visual analysis — from structure mapping to signal validation — happens in this area.
4. Indicator Sub-Charts #
Indicators such as Volume, MACD, or RSI appear in dedicated panels below the main chart.
You can resize them or reorder them from the Indicators tab (bottom panel).
💡 Remember:
Drawing tools are manual (you draw them).
Indicators are automated calculations (they’re computed).
Both complement each other for a balanced view of price behavior.
5. Right Sidebar — Watchlist & Properties #
The right-hand side of the window hosts two tabs:
Watchlist: monitor and switch between multiple symbols.
Properties: view performance, volume, and other key stats for the selected symbol.
Clicking on an item in the Watchlist instantly updates the active chart.
💡 Tip: Keep the Watchlist visible when scanning markets, and switch to the Properties tab when you need deeper context on one instrument.
6. Bottom Panel — Trading & Analysis Tabs #
Below the chart, you’ll find tabs that give access to all connected data and trading panels.
This area bridges charting with live trading.
Includes:
Indicators: manage active indicators or add new ones.
Orders: view and manage your pending or executed orders.
Positions: see your current open trades.
Brokers: connect or switch between broker accounts.
💡 Tip: You can execute and monitor trades directly here — no need to switch screens.
How It All Works Together #
The layout is designed to mirror your trading workflow:
- Select a symbol from the Watchlist or top bar.
- Set a timeframe and prepare your view.
- Draw and annotate structure using tools on the left.
- Apply indicators for confirmation via the bottom Indicators tab.
- Place and monitor trades using the Orders and Positions panels.
- Switch brokers or markets instantly from the bottom strip.
Everything you need — from analysis to execution — happens in one continuous workspace.


