RSI Indicator Explained: A Beginner’s Guide
Table of Contents
What is the RSI Indicator?
The RSI indicator, a popular tool among traders, offers a fascinating glimpse into market momentum. Essentially, it helps determine if an asset’s price is getting too enthusiastic – potentially overbought – or perhaps overly pessimistic, signaling an oversold condition. Imagine it as a gauge measuring the intensity of recent price swings; these shifts can often foreshadow changes in direction. The RSI itself ranges from 0 to 100, providing valuable insights into investor sentiment.
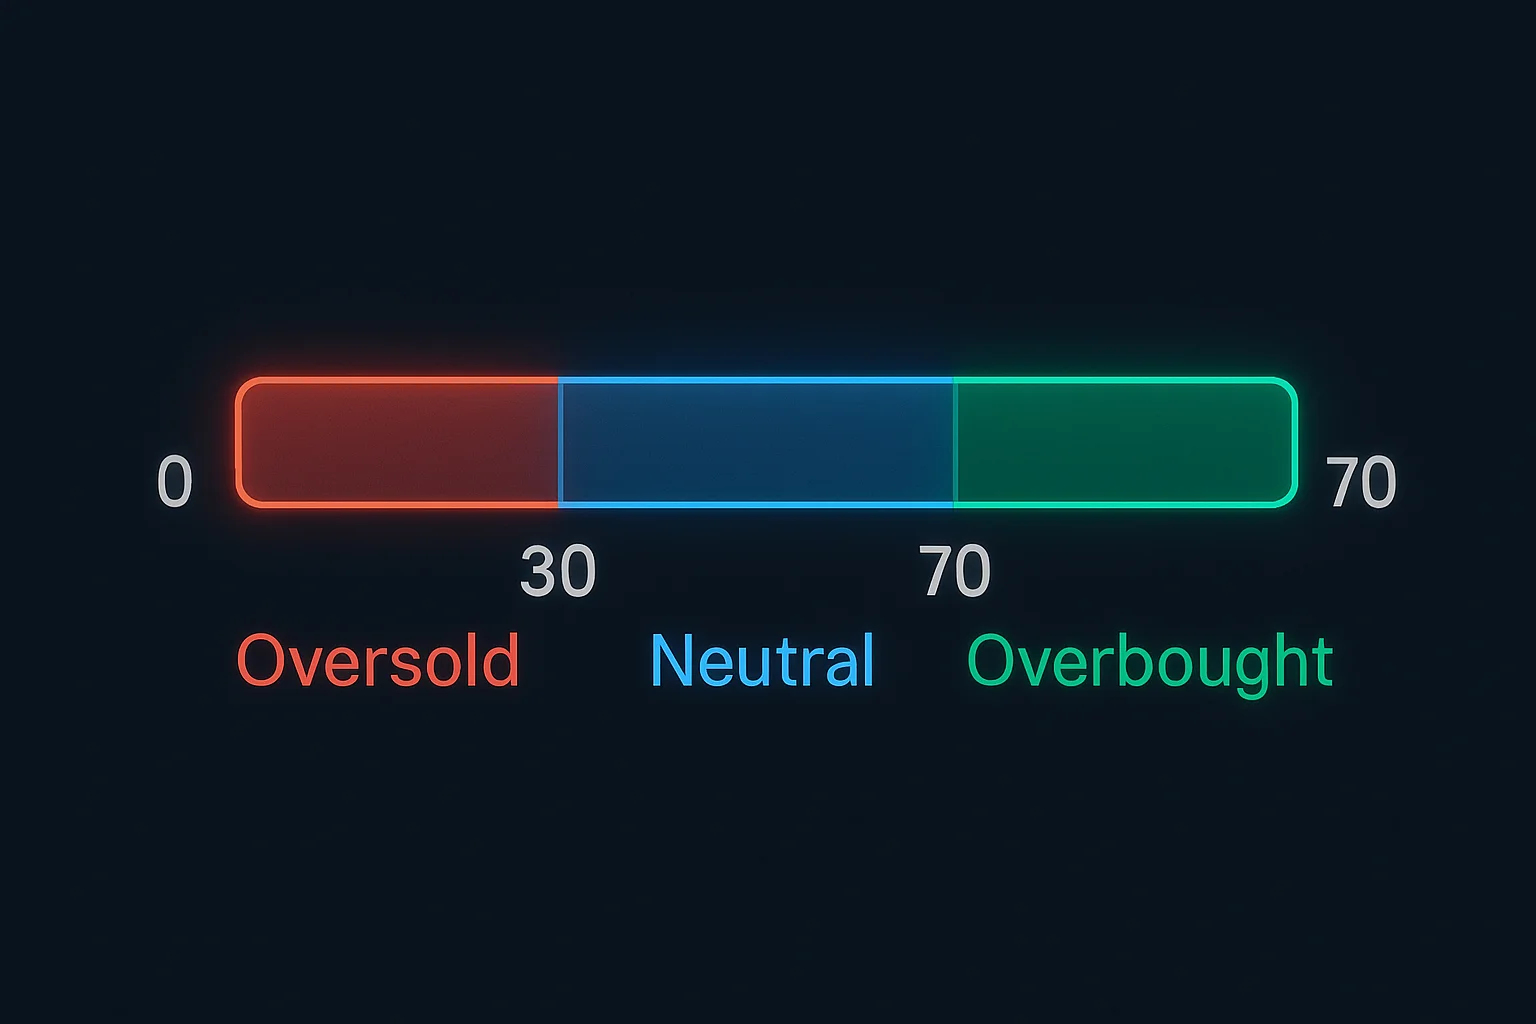
When you see a reading above 70, it might suggest that an asset is overbought and due for a correction. On the flip side, a reading below 30 could indicate oversold territory, hinting at a potential bounce back. Many experienced traders like to pair the RSI indicator with other technical analysis techniques – think of it as getting a second opinion – to confirm signals and confidently seize those exciting buying or selling opportunities.
Defining the Relative Strength Index (RSI)
The Relative Strength Index (RSI) is a really useful tool for traders – it’s essentially a gauge that shows how quickly an asset’s price has been moving. It works on a scale of 0 to 100, and can help you spot potential changes in the market. When you see a reading above 70, it often suggests overbought conditions; imagine a stock everyone is suddenly clamoring for! On the flip side, below 30 might indicate oversold territory. Understanding this indicator can definitely lead to better trading decisions.
Understanding "Relative Strength" in Trading
Figuring out relative strength is pretty useful for traders! It lets you see how an asset’s price performs compared to its peers, essentially spotlighting investments with real momentum. This can be a great way to spot opportunities and tweak your portfolio accordingly. Just remember, relative strength alone isn’t the whole story – it’s best used alongside broader market trends and those important fundamental factors.
Purpose of the RSI: Identifying Overbought and Oversold Conditions
The Relative Strength Index (RSI) offers a neat way to check an asset’s momentum – it looks at price changes to help identify when things might be getting overbought or oversold. Typically, an RSI above 70 could hint that a pullback is on the horizon, and values below 30 might suggest a chance for a bounce back. Traders often find these signals useful, though it’s worth remembering that no indicator is foolproof; pairing RSI with other analysis tools usually leads to better outcomes.
Historical Context & Development of the RSI
The Relative Strength Index (RSI)—a clever creation by J. Welles Wilder Jr. back in the 1970s—helps traders identify when markets might be overbought or oversold, a really important factor for making informed choices. He initially shared this concept in New Concepts in Technical Analysis. It’s since become hugely popular and is now an essential tool for understanding momentum and spotting potential shifts in trends – Wilder certainly left his mark on the world of finance!
Why Traders Use the RSI
Traders frequently turn to the RSI indicator—it’s a handy way to gauge an asset’s momentum, kind of like seeing if a spring is wound too tight or not enough. The RSI scale runs from 0 to 100; when it climbs above 70, that might mean an asset is overbought and due for a pullback. Conversely, readings below 30 could suggest it’s oversold and poised for a bounce. Beyond those extremes, the RSI can also confirm existing trends, and divergences sometimes offer hints of potential reversals. Ready to level up your trading? Check out our resources – they’re designed to help you refine your strategies!
How to Calculate the RSI
The Relative Strength Index (RSI) is a really useful tool for traders looking to understand market momentum – essentially, whether prices have been climbing too fast or dropping too far. It’s like getting a quick snapshot of the current situation! Calculating RSI isn’t as complicated as it sounds; you start by figuring out the average gains and losses over a period, typically 14 days. Gains are those upward price movements, while losses represent declines, naturally. Then comes Relative Strength (RS), which is simply Average Gain divided by Average Loss. Finally, that value goes into the RSI calculation itself: RSI = 100 – [100 / (1 + RS)]. Let’s say your average gain is 5 and your average loss is 2 – that gives you an RS of 2.5, resulting in an RSI around 78.6. Generally speaking, an RSI above 70 might suggest overbought territory, while a reading below 30 could indicate oversold conditions.
The RSI Formula Explained (Simplified)
The RSI indicator, or Relative Strength Index, is a helpful tool for traders wanting to see if a market feels overextended – either too high or too low. It essentially looks at price changes, averaging gains and losses (usually over 14 days), to give you an RSI value between 0 and 100. A higher number might suggest things have climbed too far, while a lower reading could indicate it’s dipped down more than it should.
Automatic Calculation on Charting Platforms
Technical analysis can feel overwhelming, right? Thankfully, charting platforms make it so much easier. They automate those tricky calculations – things like moving averages and Fibonacci retracements – freeing you up to actually understand the signals. Plus, they’re incredibly accessible, presenting data in a clear way whether you’re just starting out or an experienced trader. Think about effortlessly tracking the RSI indicator or MACD! It’s truly powerful. Ready to analyze smarter? Explore charting platforms and unlock a more efficient trading journey today!
Understanding RSI Values
The Relative Strength Index (RSI) is a really useful tool for technical analysis – it helps traders figure out if an asset’s price has gone too far, either up or down. Imagine it as a quick check to see if something’s been stretched too much! Measured on a scale of 0 to 100, the RSI can give you some hints. Generally, when you see a reading above 70, it might mean an asset is overbought and could correct itself soon. Conversely, a value below 30 could suggest it’s oversold and poised for a rebound.
Of course, these levels are just one piece of the puzzle; don’t rely on the RSI alone! It’s always best to confirm signals with other technical indicators or by simply watching how prices move. Want to learn more about how this RSI indicator functions and all its applications? You can find a great explanation here.
Interpreting RSI Levels: 0-30, 30-70, 70+
The Relative Strength Index, or RSI, is a really useful tool for traders trying to get a sense of where prices are headed. When you see an RSI below 30, it often means the market’s oversold – kind of like spotting a great deal! Values between 30 and 70 generally suggest things are neutral; it’s always good to look at other factors too. Keep in mind that oversold doesn’t guarantee prices will bounce back immediately. And, an RSI above 70 might signal the market is overbought, potentially indicating a pullback could happen. Want to dive deeper into using this RSI indicator? Investopedias comprehensive guide has you covered.
Overbought and Oversold Zones in Detail
Spotting overbought and oversold zones is a crucial part of technical analysis—it’s like noticing a stretched rubber band about to snap! The Relative Strength Index (RSI), for instance, often signals levels above 70 as overbought, while below 30 suggests an oversold condition. Similarly, the Stochastic Oscillator uses 80/20 thresholds. These indicators can hint at potential price corrections.
For example, a high RSI reading like 85 might suggest a pullback is on its way, but always look for confirmation from other signals. Keep in mind that these zones aren’t definitive buy or sell points; they’re areas requiring closer inspection. https://www.investopedia.com/terms/o/oversold.asp
Visual Examples of RSI Readings on Charts
Understanding how the RSI indicator appears on charts is a really important step for any trader looking to make informed decisions. You’ll typically find it displayed below a price chart, fluctuating between 0 and 100. A reading above 70 might signal an asset is overbought – possibly indicating a small pullback is coming. On the flip side, values dipping below 30 could suggest it’s oversold and ready for a bounce back. Keep an eye out for divergence patterns too; when prices move one way but the RSI indicator doesn’t follow, that can offer some valuable insights. Want to refine your trading skills? [Link to further resources]
Interpreting the RSI: Common Trading Signals
The Relative Strength Index (RSI) is a really useful momentum indicator – it looks at how prices have been changing to give you an idea of whether an asset might be overbought or oversold. It’s kind of like checking if a rubber band has been stretched too far! Generally, values above 70 suggest it’s overbought and could soon pull back, while those below 30 might mean it’s oversold, potentially presenting a good buying opportunity. Of course, these are just guidelines, so always double-check with other technical indicators for confirmation.
Here’s a quick rundown of common RSI signals to keep an eye on:
– RSI above 70: Could be a signal to consider selling.
* RSI below 30: Might suggest a good time to buy.
1. Divergences – when the price and the RSI are moving in opposite directions – can sometimes hint at upcoming reversals.
2. Adding moving averages can help smooth out any sudden spikes you see.
Divergences (Bullish & Bearish)
Technical analysis occasionally reveals intriguing moments – divergences! Think of it as a disagreement between price movements and an RSI indicator. A bullish divergence might suggest prices could rise, for example, seeing the price drop to lower lows while the RSI shows higher lows. On the flip side, a bearish divergence could signal a potential downturn; you’ll notice prices climbing to higher highs alongside a RSI indicator dipping to lower lows. Remember, divergences don’t guarantee reversals. It’s always smart to confirm with other tools – combining the RSI indicator and volume analysis can really strengthen your trading decisions.
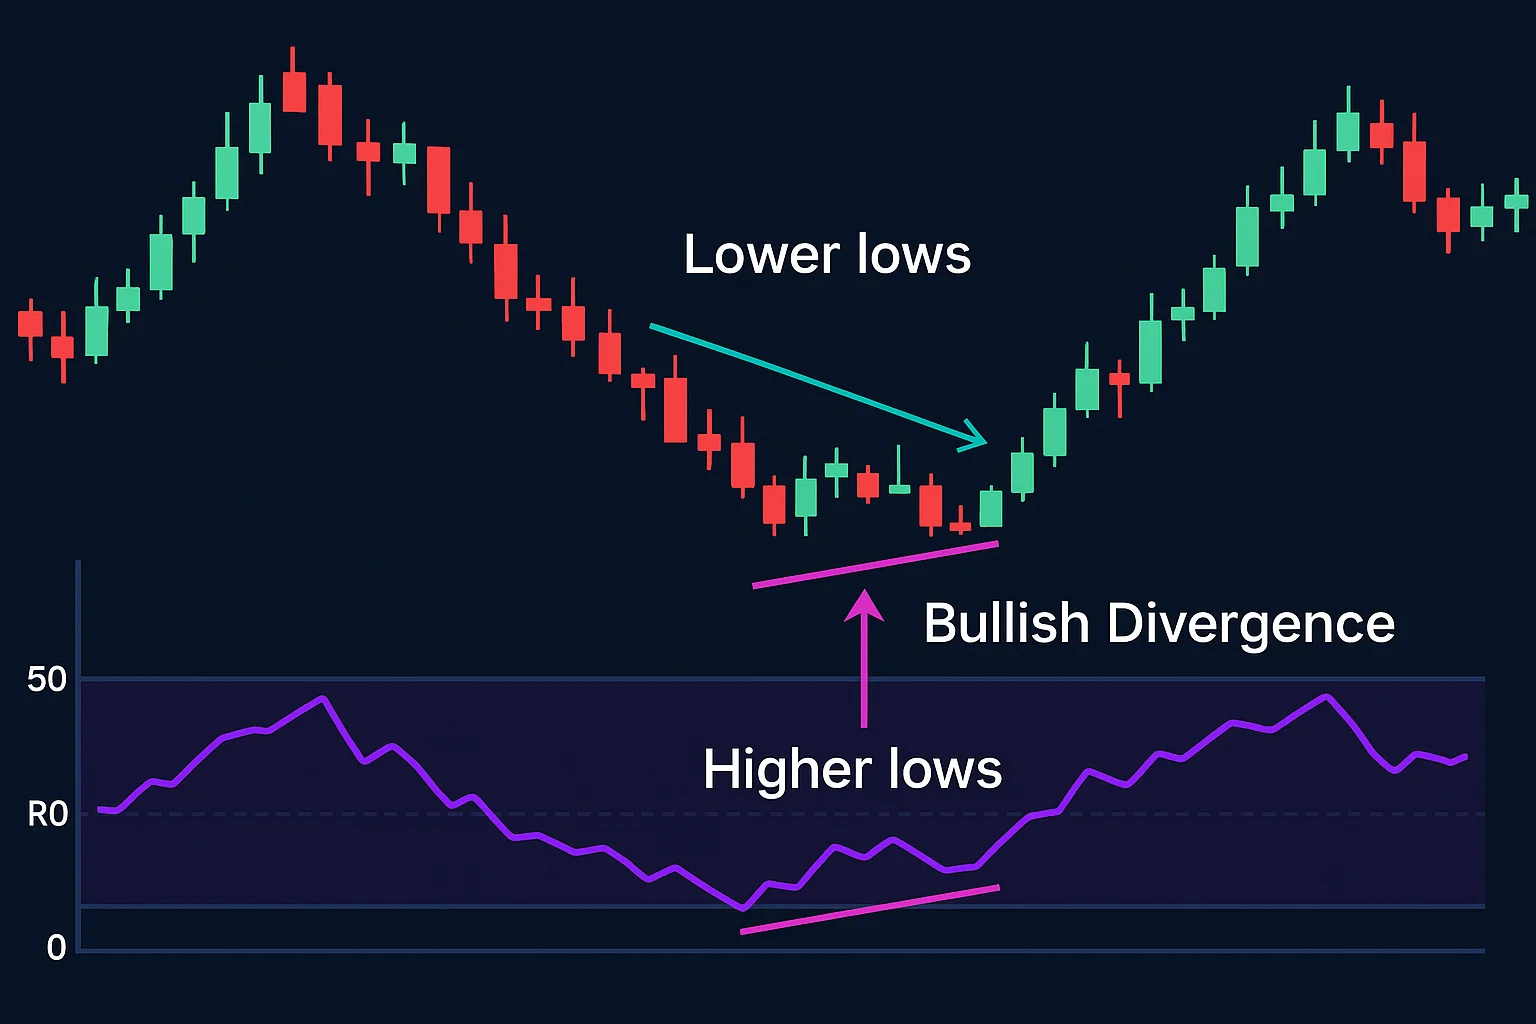
Identifying Bullish Divergence
Spotting a bullish divergence? That’s often an exciting sign, potentially signaling a market reversal! Keep an eye out for price action forming lower lows, but with the RSI indicator displaying higher lows – it’s almost like momentum is quietly gathering strength. This disconnect suggests that selling pressure might be easing even as prices decline. Confirmation really solidifies this pattern’s usefulness as a valuable trading signal.
Identifying Bearish Divergence
Spotting bearish divergence can be a real eye-opener! Picture this: prices are soaring, but the RSI indicator reveals slowing momentum – those lower highs suggest waning bullish power. It’s a crucial signal for traders to watch closely. Keep in mind though, divergence isn’t a guaranteed prediction; confirming with future price movements is essential for smarter trades.
Crossovers and Trend Confirmation
Many traders rely on moving average crossovers to identify possible changes in market trends—essentially, a quick signal versus a more established direction. However, it’s important not to jump to conclusions! Acting solely on these crossovers can be misleading; confirmation is key. Strengthening their reliability often involves pairing them with other indicators like the RSI indicator. For example, confirming a 50-day/200-day crossover alongside bullish RSI divergence adds more confidence—and combining MACD with volume analysis offers even greater refinement.
Combining RSI with Other Indicators (e.g., Moving Averages)
Want to boost your trading? Combining the RSI indicator with moving averages is a smart move! Think about this: an RSI showing bullish potential – climbing above 50 – and then prices pushing past a 50-day moving average. That’s often a pretty reliable buy signal, wouldn’t you agree? This pairing helps reduce those false alarms that can pop up when using either tool alone. Just remember, relying solely on this combination might not catch the quickest market shifts, so consider tweaking your moving average period and always prioritize risk management.
Realistic Trade Scenarios Using RSI
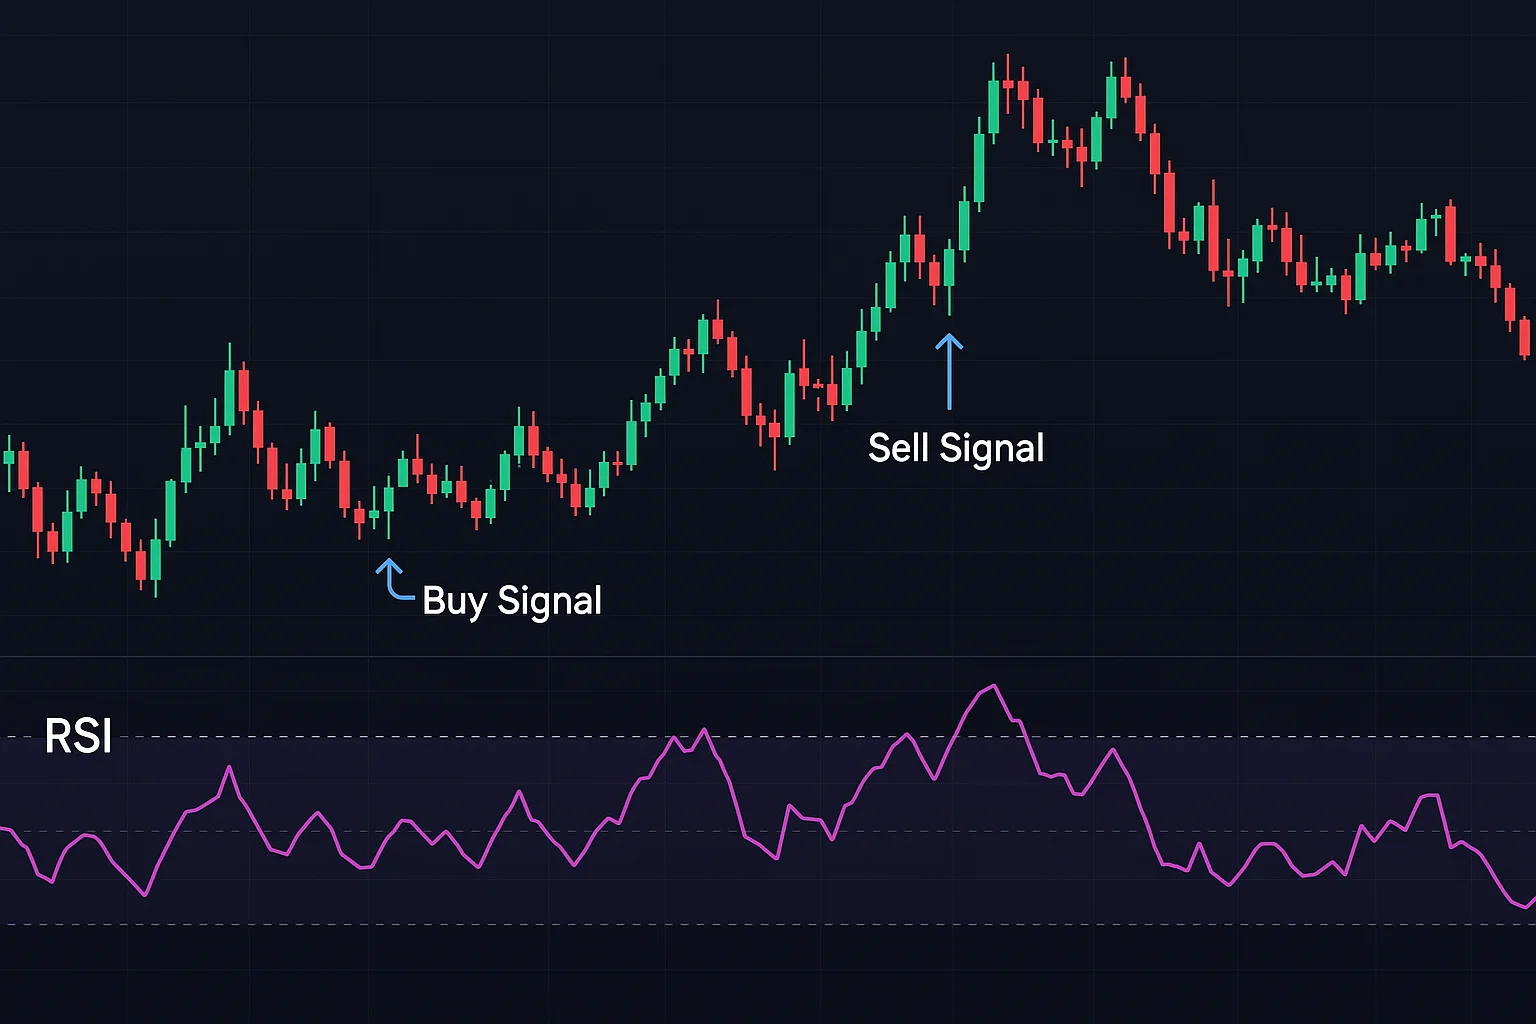
The RSI indicator offers some valuable insights for traders – it’s like having an extra set of eyes on the market! For example, when you see that RSI dip down to 30, it often hints at a potential oversold situation; many consider this a good buying opportunity. Conversely, if it shoots up past 70, things might be overbought, and a sell signal could emerge. Of course, pinpointing the perfect entry point usually involves using other technical analysis tools alongside it.
Think of it this way: an RSI bouncing back above 30 after falling below can reinforce an upward trend. And if you notice it dropping below 70 following a price increase? That could suggest a shift towards bearish territory. Remember to always combine these signals with broader market trends and, most importantly, manage your risk!
RSI Limitations & Considerations
The Relative Strength Index (RSI) is a really useful tool for traders, but it’s good to keep its limitations in mind if you want to be successful. It’s easy to get caught up focusing just on those overbought (above 70) and oversold (below 30) signals – we’ve all been there! However, markets can sometimes linger in these states for quite a while, which can lead to some confusing signals. Think of the RSI as primarily showing shifts in momentum; it doesn’t necessarily predict when a trend will actually change direction. And remember, no indicator is perfect.
To really use the RSI indicator well, try incorporating it into a broader trading strategy. Pairing it with other technical analysis tools – like moving averages or looking at volume – can give you extra confirmation. Always consider the bigger picture and what’s happening in the market before acting on those RSI signals; otherwise, you might end up making some less-than-ideal choices.
The Risk of Whipsaws and False Signals
Traders relying on technical indicators, especially the RSI indicator, should keep a watchful eye out for whipsaws and false signals – they can definitely introduce some risk! A whipsaw feels like a sudden reversal in price, throwing conflicting signals your way (buy, then sell!), which might tempt you into hasty trades. False signals are similar; fleeting market movements can seem significant but often disappear quickly.
Confirmation is key here. Don’t jump to trade based solely on an RSI indicator reading! Instead, look for supporting evidence from other indicators or even just how the price is behaving – perhaps waiting for a volume confirmation before acting.
Avoiding Over-Reliance on the RSI Alone
The RSI indicator is helpful for identifying when markets might be overbought or oversold, but it’s best not to rely on it exclusively. It’s like using only one tool – you could miss important details! Especially in volatile times, the RSI can sometimes give misleading signals, so diversifying your approach is really smart. Don’t base trades solely on the Relative Strength Index; instead, consider it as just one piece of a larger puzzle. Confirming those signals with other technical indicators or even fundamental analysis will improve accuracy and help minimize potential losses – a more complete view leads to better results.
Importance of Timeframe Selection for RSI Analysis
Getting RSI analysis right really hinges on choosing the correct timeframe. It’s fascinating how much the Relative Strength Index can shift depending on whether you’re examining a quick 5-minute chart or a longer daily one! Day traders frequently opt for shorter periods, like 14, but investors might find weekly views more helpful. Selecting an unsuitable timeframe can lead to misleading signals, so don’t hesitate to experiment and discover what aligns best with your trading strategy. Curious to delve deeper? Check out our guide on understanding RSI!
Using flows.trading to Track Your RSI Analysis
flows.trading aims to make RSI indicator tracking straightforward – whether you’re just starting out or a seasoned pro. Picture this: seeing those RSI values directly on your charts, moving right along with price action! It’s incredibly convenient. You can easily tweak timeframes and play around with different settings, like the popular 14-day period, to really dial in your trading approach. To save you some precious time, why not create templates for your go-to configurations? Then, apply them consistently across all sorts of assets.
Beyond that, flows.trading offers robust data management tools to keep your RSI analyses neat and tidy. Set up alerts to let you know when things might be getting overbought or oversold – even catch those divergence patterns! And with backtesting, you can review how things have performed historically. Plus, sharing charts and insights is a snap, making it easy to collaborate with other traders.
Recording Observations and Trade Performance
Really boosting your trading success? It starts with keeping a record of what you do! A trading journal – even just jotting down when you get in and out of trades – provides amazing insights for later. Regularly documenting helps reveal those patterns and biases that can sneak into our decisions; it’s kind of like tracking habits to become a better version of yourself, right? And observing how the market moves alongside your trade results is key to refining your strategy. If you’re looking to streamline things and learn more about the RSI indicator, check out https://flows.trading/forex-trading-journal/.
Leveraging Data for Improved Trading Decisions
Data’s become essential for successful trading these days! Looking at historical prices and trading volume—it’s like uncovering hidden clues—can reveal patterns you might otherwise miss. Plus, incorporating news sentiment analysis gives you even more insight to anticipate market changes. This data-driven approach really does improve your decisions.
Of course, before jumping in, backtesting is crucial. For example, the RSI indicator can spotlight potential overbought or oversold situations. Consistent analysis and thorough testing significantly increase your odds of making profitable trades.
Link to https://flows.trading
Want to elevate your trading game? Flows Trading provides a fantastic platform packed with tools designed to sharpen your skills. You’ll find advanced technical analysis, helpful strategies, and valuable insights – think understanding the RSI indicator or spotting those tell-tale chart patterns. Whether you’re just starting out or already experienced, Flows can help. Ready to unlock your potential? Head over to https://flows.trading and begin mastering technical analysis today!
Conclusion
Becoming proficient in technical analysis—particularly with tools like the RSI indicator—really does require consistent practice and a willingness to learn. A few things to remember as you’re getting started: using the RSI helps identify potentially overbought or oversold assets, spotting divergence signals can be valuable, and it’s most effective when integrated into a broader trading strategy. This guide has hopefully provided a good foundation for understanding the Relative Strength Index.
To continue your journey, explore other indicators and chart patterns—consistent application is key! With focused effort, you’ll find that technical analysis can lead to more informed trading decisions and a better grasp of market dynamics. Navigating financial markets isn’t always easy, but embracing the challenge is part of the process.
Key Takeaways: Mastering the RSI Indicator
Grasping how the RSI indicator works is a really useful skill for traders! It’s like having a quick way to see if an asset’s price has climbed too high (above 70, meaning it might be overbought) or dropped too low (below 30, suggesting it could be oversold and ready for a bounce). Imagine a stretched spring – eventually, it snaps back! To get the most out of it, pair the RSI with other technical analysis tools. Also, watch for divergence between price movements and what the RSI indicator is showing; that can often foreshadow changes in the trend.
The Importance of Practice and Risk Management
Becoming a successful trader really hinges on consistent effort. Regularly practicing, even just by simulating trades, allows you to refine your strategies and make better decisions—all without putting actual funds at risk! This focused approach builds confidence and reveals areas where you can improve. Of course, risk management is crucial; it protects your investments and helps avoid big losses.
Keeping a journal of your trades – noting why you made each move and what happened afterward – offers valuable insights. Looking back at past performance can help you identify patterns and tweak your approach. Combining dedicated practice with smart risk mitigation significantly increases your odds of consistent profitability.
Experimenting with the RSI in a Demo Account
Getting familiar with the RSI indicator can feel a bit daunting at first, right? That’s why trying it out in a demo account is such a smart move – you get to practice without any risk! Play around with charting tools and look back at historical data; that’s where the real learning happens. This risk-free approach builds confidence before you even think about live trading. Experiment with different RSI signals, like spotting overbought or oversold conditions, and see how it pairs with other indicators. Ready to level up your understanding? Check out our detailed guide on the Relative Strength Index – you’ll be glad you did!