Technical Analysis Tools for Beginner Traders
Table of Contents
What is Technical Analysis and Why Should Beginners Use It?
Ever wonder how seasoned traders seem to predict market shifts? Technical analysis is a remarkably powerful method they use – it’s all about studying past price movements and trading volume, rather than focusing on a company’s financials. Think of it as spotting patterns in charts; these can reveal some truly exciting trading opportunities! The core idea is that history often repeats itself in the market.
If you’re new to this, technical analysis offers some really accessible tools for understanding how markets function. Recognizing common chart patterns – like head and shoulders or triangles – can provide valuable insights. Identifying existing trends, whether they’re rising or falling, helps you make smarter decisions. Simple indicators, such as moving averages, further refine these observations, giving new traders a greater sense of control.
Benefits of Technical Analysis for New Traders
New to trading? Technical analysis offers a fantastic visual edge by illustrating how markets behave. Recognizing patterns – think head and shoulders or triangles – can offer clues about potential price shifts; you don’t need an advanced finance degree! This method uses charts and indicators, making it surprisingly accessible for beginners looking to understand trends and make informed decisions using technical analysis.
Plus, it’s a great way to manage risk. For example, moving averages can highlight areas where prices might find support or resistance. The more you practice charting, the easier it becomes – building your confidence and refining your trading strategies.
Identifying Trends & Patterns
Understanding market trends is vital for traders, and technical analysis offers valuable insights. It’s about looking beyond just whether prices are up or down – consider what’s actually happening! Notice things like spikes in trading volume or periods of price stability; these observable actions can hint at future movements. Remember though, patterns don’t always mean cause and effect—further investigation is often needed.
Making Informed Trading Decisions
Smart trading really comes down to thoughtful analysis. Begin by looking back at past results – what worked, what didn’t? Technical analysis, with tools like charting, can reveal helpful market trends. It’s key to stay objective and avoid emotional reactions when reviewing your data. Keeping a trade journal is incredibly useful for self-assessment; regularly review it to spot patterns and refine your approach.
Common Misconceptions About Technical Analysis
Thinking technical analysis is simply about predicting the future based on past patterns? It’s actually more complex than that. Really, it’s about identifying probabilities and recognizing important support and resistance levels. Remember, technical indicators aren’t crystal balls – they offer helpful insights, but work best when you consider other factors too! There’s a bit of subjectivity involved, sure, but established charting principles give you a strong base to build on. To truly master technical analysis, it’s about understanding these details and combining different tools for better trading choices. Ready to level up your strategy? Check out our resources!
Essential Chart Types for Beginner Traders
If you’re just starting out with technical analysis, one of the first things to get familiar with is different chart types – they’re really key! The line chart is probably what most people picture when they think of a stock chart; it simply connects price points, showing trends over time. It’s like drawing a path on a map, really. Then you have bar charts which add more detail—each bar shows the open, high, low, and close prices for a given period, giving you a quick look at the range. Candlestick charts are similar but use colored blocks – or ‘candles’ – to display that same information in a way that makes it easier to spot those bullish or bearish patterns.
- Line Charts: Excellent for spotting trends.
- Bar Charts: A fast way to see price ranges.
- Candlestick Charts: Useful for recognizing patterns and understanding how the market feels.
Line Charts: A Simple Starting Point
Line charts offer a really approachable way to dive into technical analysis, particularly if you’re just starting out in trading. They’re great for visualizing how things change over time – think about tracking stock prices week by week! It’s easy to spot trends; a line heading upwards usually means good news, while one going down might suggest caution. Try to keep things simple and focus on the overall picture instead of getting caught up in tiny fluctuations.
Recognizing patterns is key when working with these charts. A consistently rising line often points to positive momentum, but a downward slope could indicate potential weakness. Practice analyzing historical data; it’s essential for spotting meaningful trends and making smarter trading decisions.
Understanding Highs, Lows, and Close Prices
Understanding technical analysis really comes down to noticing highs, lows, and those closing prices—they’re surprisingly revealing! The high represents the day’s peak, while the low shows you the bottom. Interestingly, that final close often carries significant weight for what happens next. Savvy traders use this information to identify trends and potential support/resistance levels, helping guide their decisions.
Bar Charts (OHLC): More Detail at a Glance
Ever feel like a basic line chart just isn’t telling the whole story? That’s where OHLC bars come in! These charts, particularly useful for technical analysis, offer a much richer view of price action. Imagine each bar as a quick snapshot—it displays the Open, High, Low, and Close prices within a specific timeframe. It’s a fantastic way to quickly see how much the price fluctuated and its general direction, revealing potential support/resistance levels too. Learn more about OHLC bars here.
Candlestick Charts: Visualizing Price Action
Candlestick charts are a really useful tool for technical analysis, don’t you think? They give you a clear picture of how prices change over time, showing the open, close, high, and low for each period. It’s neat – the ‘body’ shows the difference between opening and closing, while those wicks tell you about the highest and lowest points reached during that time. Traders often use them to get a feel for market sentiment and spot potential trading opportunities.
Spotting candlestick patterns can be helpful too; a doji, for example, frequently suggests indecision in the market. Curious to learn more? Investopedia has a great explanation: https://www.investopedia.com/terms/c/candlestickchart.asp. Why not start exploring price action and improving your trading strategy today?
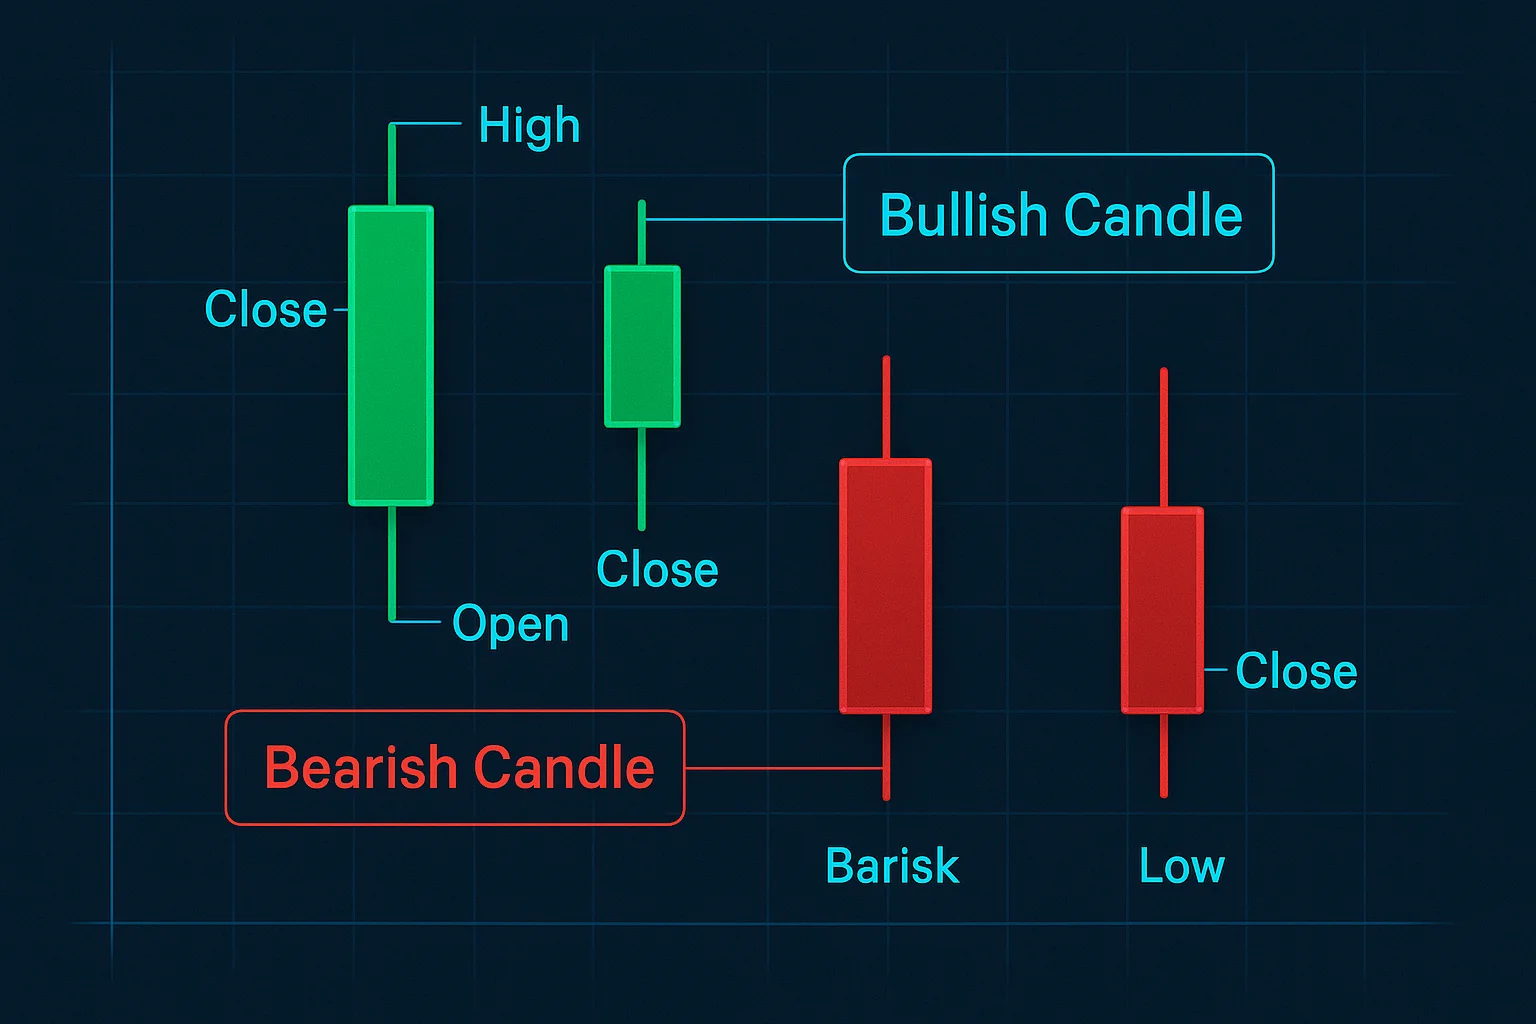
Bullish vs. Bearish Candles
Understanding technical analysis often starts with candlestick patterns—they’re like visual snapshots of market sentiment! Bullish candles, imagine eager buyers pushing prices up, have a long body and short wicks. On the flip side, bearish candles suggest sellers are in control, indicated by those longer lower wicks. Spotting these basic shapes can really help traders interpret charts more effectively.
Key Technical Indicators to Get Started With
If you’re just starting out with technical analysis, understanding some key indicators will really help you along the way. Let’s start with Moving Averages (MAs) – they essentially smooth out price data, making it easier to spot those underlying trends; a rising MA often hints at an uptrend. Then there’s the Relative Strength Index (RSI), which looks at recent price changes and can alert you when an asset might be overbought or oversold. And finally, the MACD shows the relationship between two moving averages, potentially pointing out good times to buy or sell. These tools give you a great look into market momentum.
Here’s a quick rundown:
- Moving Averages: Great for trend identification.
- RSI: Helps identify overbought/oversold situations.
- MACD: Can signal shifts in momentum.
To get the hang of it, try practicing with historical charts. Combining these indicators can also give you stronger signals. Just remember that technical analysis is a fantastic tool, but always prioritize smart risk management!
Trend-Following Indicators
Trend-following indicators can be really helpful tools in technical analysis, especially when you’re trying to get a sense of where the market’s heading. It’s like seeing a river already flowing – you notice the trend is there! While they might lag a bit behind, these indicators provide solid signals for momentum trading and help filter out some of that short-term noise. Popular examples include Moving Averages (both simple and exponential), which smooth price data to highlight trends, and the MACD.
Moving Averages (MA) - Simple & Exponential
Understanding technical analysis often involves exploring moving averages (MA). These tools smooth out price data, making trends easier to spot. A Simple Moving Average (SMA) is like figuring your average grade – it considers all prices equally over a period. Exponential Moving Averages (EMA), on the other hand, give more weight to recent activity, reacting faster but sometimes causing whipsaws.
MACD (Moving Average Convergence Divergence)
The MACD indicator is seriously helpful for technical analysis—it’s like having an early warning system for shifts in momentum and potential trend reversals! Basically, it compares two moving averages, one fast and one slow, showing you convergence and divergence. The histogram gives a quick visual of the difference between those lines. Many traders watch for buy signals when the MACD line jumps above the signal line, while a cross below suggests selling. Understanding MACD can really empower your trading decisions.
Momentum Indicators
Ever wonder how to gauge the speed of price movements? Technical analysis often uses momentum indicators – think of them as helpful gauges showing just how quickly and strongly prices are changing. Tools like the RSI, MACD, and Stochastic Oscillator can be really insightful. They frequently flag when an asset might be overbought or oversold, potentially hinting at a change in direction. Ultimately, understanding these signals can help you make smarter trading choices.
RSI (Relative Strength Index)
The Relative Strength Index (RSI) is a really useful tool for technical analysis – it’s like having a quick gauge to see if an asset’s price has jumped around too much recently! It works on a scale from 0 to 100, looking at those recent price changes. Generally, values above 70 might suggest things are overbought, and below 30 could mean it’s oversold – perhaps signaling a shift in the trend.
Stochastic Oscillator
The Stochastic Oscillator is a really useful momentum indicator in technical analysis. It’s like getting a sense of how quickly prices are moving – helping you spot potential overbought or oversold situations, for example, when a stock seems too expensive or cheap. Often using a 14-day period, values above 80 can signal an overbought market, while those below 20 suggest it’s oversold. Traders frequently use this to anticipate possible trend reversals.
Volume-Based Indicators
Understanding market participation is key in trading, and that’s where volume-based indicators come into play within technical analysis. They’re essentially another set of eyes, using trading volume to confirm price trends or even hint at potential reversals – a really helpful way to refine your decisions. You might explore tools like Volume Price Trend Analysis (VPTA), which connects volume with price changes, or On Balance Volume (OBV), tracking cumulative volume over time. Really getting the hang of technical analysis can significantly boost any trader’s strategy. Want to dive deeper into these techniques?
On Balance Volume (OBV)
For beginner traders, OBV, or On Balance Volume, offers a neat way to link price movements with trading volume—essentially, it’s a momentum indicator. Imagine it as a continuous score; rising prices paired with increased volume suggest buying strength, while the opposite hints at selling pressure. Spotting differences between what’s happening with price and OBV can sometimes signal shifts in trends, giving you valuable insights.
Reading and Interpreting Charts Effectively
Understanding charts is a cornerstone of technical analysis, and it’s something every trader should prioritize. Being able to read them well unlocks the potential to identify promising opportunities and handle risk with greater confidence. Pay close attention to those axes, labels, and legends – they provide crucial context! Recognizing trends—whether prices are climbing, declining, or staying put—is essential, as is spotting common patterns like head and shoulders or triangles. It really does boost your ability to make informed trading decisions.
To get better at interpreting charts, try to focus on the bigger picture instead of getting caught up in short-term fluctuations. Looking at different timeframes can give you a much broader perspective. Here are a few things that help: pinpointing key support and resistance levels, confirming price movements with volume data, and consistently practicing with various chart types to build your expertise. Ultimately, solid technical analysis hinges on this vital skill.
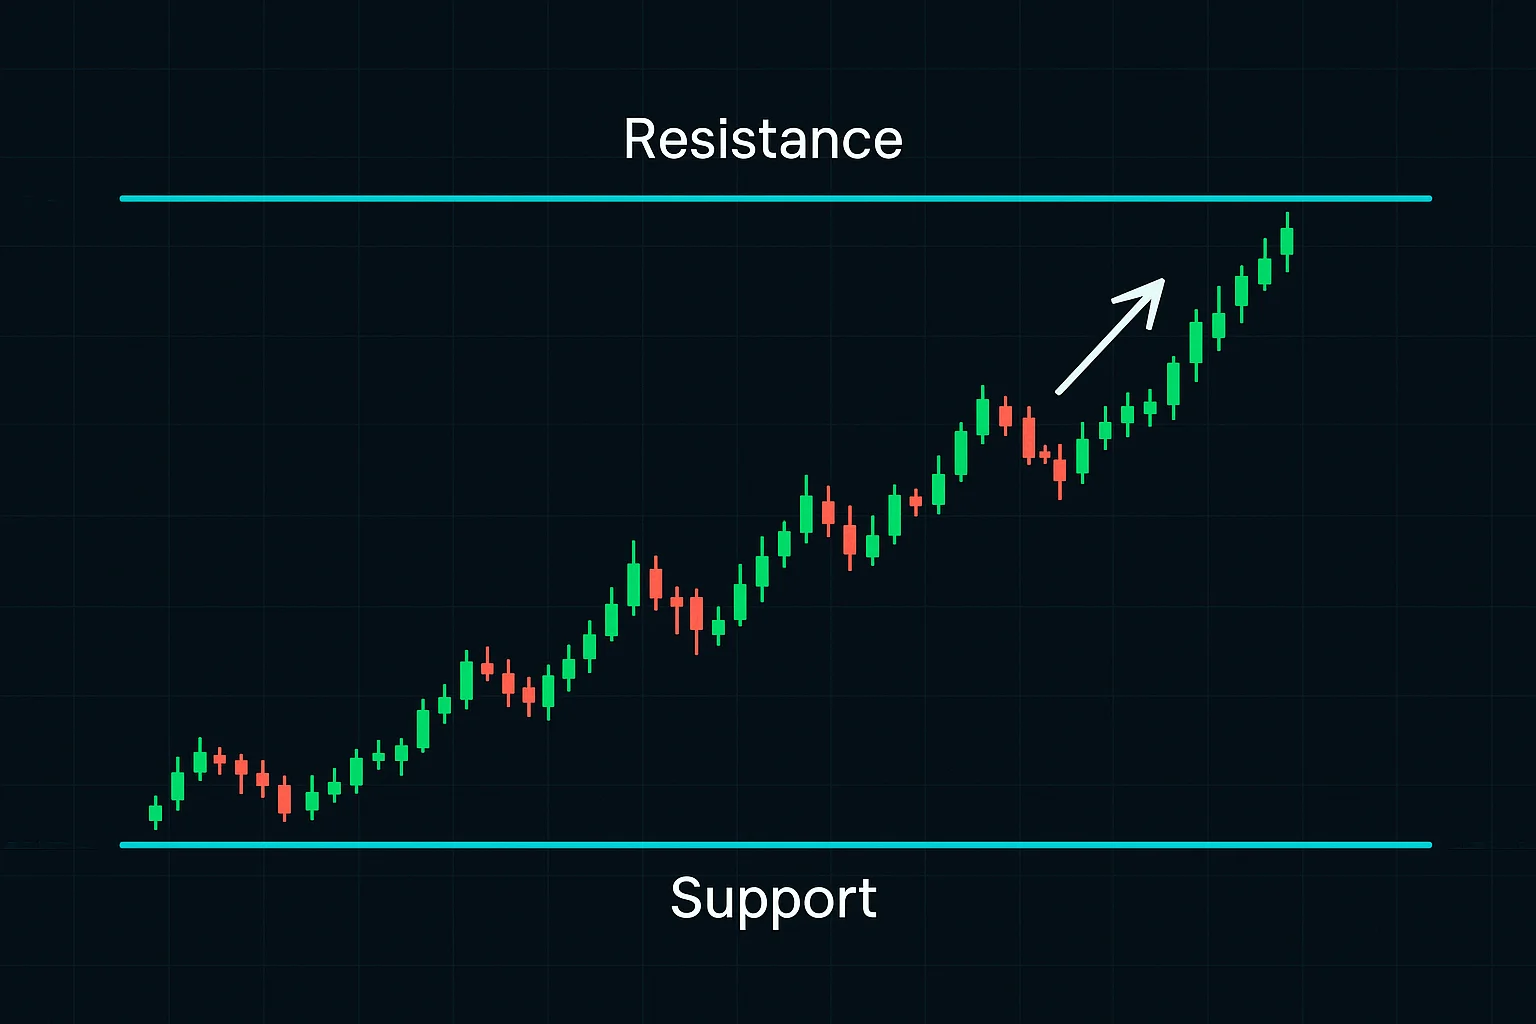
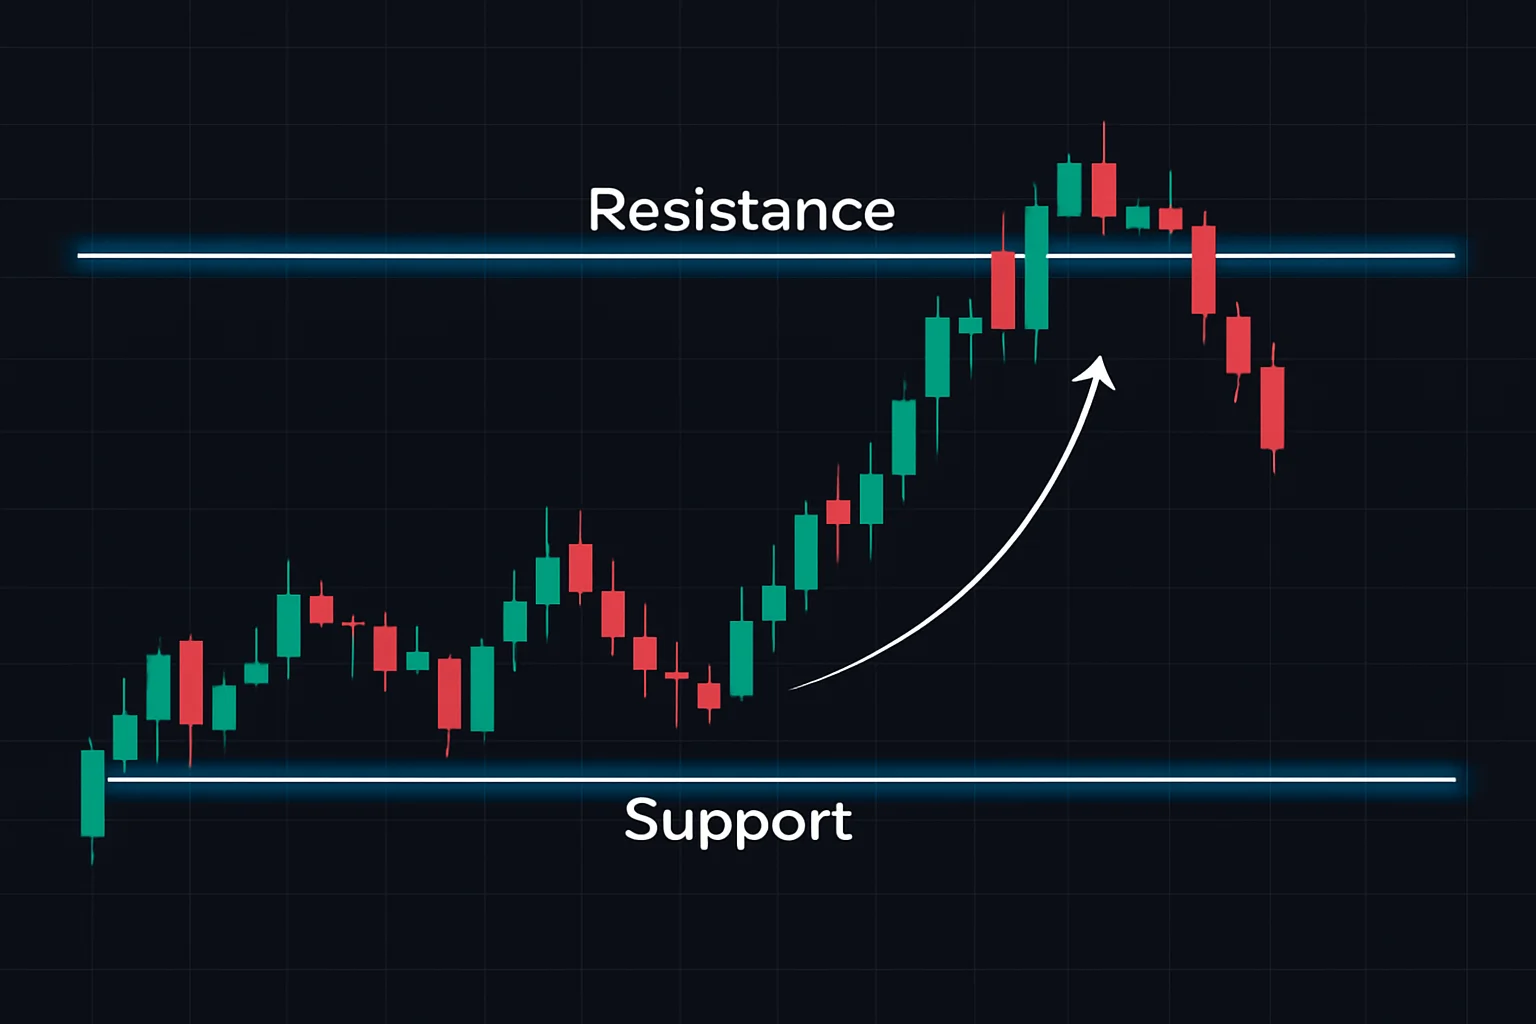
Identifying Support and Resistance Levels
Understanding support and resistance levels is really important in technical analysis – it’s like looking at a chart and seeing where prices tend to bounce back or stop moving higher. These areas often show up as horizontal lines, hinting at what might happen next in the market. Interestingly, psychological factors play a role; round numbers, for example, can make these levels even stronger! Recognizing them helps traders plan their moves, anticipating potential shifts.
Psychological Levels
Ever notice how emotions sometimes seem to hijack your trades? Traders frequently grapple with psychological levels impacting their performance—it’s a fascinating area! Think of it in layers: the conscious mind for deliberate choices, the subconscious, built on habits, and the unconscious, fueled by feelings. Becoming aware of these is key to better self-awareness.
To help prioritize those conscious decisions, consider disciplined strategies like journaling and questioning your technical analysis biases. Ultimately, greater awareness can pave the way for more consistent and profitable trading.
Chart Patterns: Recognizing Common Formations
Spotting chart patterns is really important for technical analysis – it’s like getting visual hints about what the market’s feeling. You know, formations such as head and shoulders often suggest a reversal might be coming; triangles can point to continuation, and flags usually show short-term trends. Recognizing these shapes helps traders anticipate potential price movements.
Traders frequently combine patterns with other indicators for even better results – a bullish pennant, for instance, can confirm an upward trend after things have settled down a bit. Improving your pattern recognition skills will definitely enhance your market analysis. Want to level up your trading? Give it a try today!
Head and Shoulders, Double Tops/Bottoms
Head and Shoulders patterns are popular technical analysis tools, frequently used to spot potential trend reversals. Think of a bearish pattern like seeing a face – left shoulder, head, then right shoulder – it can suggest a downtrend is weakening. Conversely, an inverted version might signal the end of an uptrend! It’s important to confirm these signals; traders often look for price breaking through the neckline and consider volume alongside other indicators before making moves.
The Power of a Trading Journal for Beginners
For those just starting out in trading, keeping a trading journal can be an incredibly useful tool for growth – and it’s far more than just recording whether you made or lost money! It’s really about documenting your thought process behind each trade. What led you to make that specific decision? Think about noting your entry and exit points, how you managed risk, and the technical analysis or fundamental reasoning that influenced your actions. Consistent journaling helps build self-awareness; it allows you to spot patterns in your trading behavior – both positive and negative – which is key for continuous improvement.
Consider a trading journal as a learning log where you explain why you took a trade, not just if it was profitable. You might find it helpful to organize your thoughts like this:
- What market conditions did you observe?
- Which indicators (if any) did you use?
- How were you feeling emotionally during the trade?
Remember, the goal is always about refining your process, regardless of whether a trade turns out well or not. Even basic technical analysis emphasizes journaling as an important part of learning.
Why Keep a Trading Journal?
Want to level up your trading game? A trading journal is an incredibly useful tool – think of it as your own personal coach! It lets you objectively look back at what you’ve done, identify patterns in both your wins and losses, and adjust your trading strategy accordingly. This kind of self-reflection really helps minimize those emotional reactions that can derail performance.
Here’s how a journal can help:
- Tracking entries provides data perfect for backtesting.
- Analyzing win/loss ratios quickly reveals areas where you excel or need work.
- Consistent journaling supports long-term growth in technical analysis. Ultimately, it transforms trading from feeling like guesswork into a disciplined process driven by solid data.
Tracking Performance & Identifying Mistakes
Tracking your trading journey is essential for improvement! Keeping a detailed record—whether it’s in a journal or spreadsheet—of each trade’s entry and exit points can be incredibly insightful. Plus, technical analysis tools like charting software often reveal patterns and biases you might not notice otherwise. Let’s turn those observations into concrete steps to sharpen your trading strategy.
What to Record in Your Journal
Consistent growth in trading really hinges on having a solid journal. Think of it as your personal record – jot down the nitty-gritty details of each trade, like exactly where you entered and exited, what technical analysis led you there, and how you handled risk. Don’t forget to note broader market conditions too; was it unusually volatile or did major news events play a role?
And please, don’t gloss over losses! Figuring out why a trade didn’t pan out is crucial for learning. Write clearly so you can easily understand your entries later on – consistent journaling builds self-awareness and ultimately refines your trading strategy.
Entry/Exit Points, Reasoning, Emotions
Sometimes, trading isn’t just about the numbers; our feelings often play a role in entry/exit points. Ever felt that rush of fear pushing you out too soon, or maybe greed holding you back? Recognizing this psychological aspect is vital for better technical analysis. Becoming more self-aware helps us minimize those biases. It’s easy to fall into traps like panicking during losses or chasing gains—understanding why these emotions happen builds discipline and leads to smarter decisions.
Tools and Apps for Journaling
Finding the right journaling app can really streamline things for traders – it’s surprisingly helpful! Day One is known for its clean design and organization, while Bear shines if you enjoy longer posts with markdown. For those wanting something tailored to trading, Trader’s Journal does a fantastic job of tracking trades and important performance metrics.
Consistent journaling makes detailed record-keeping much easier, allowing for better analysis of your strategies and encouraging valuable self-reflection. Ready to level up your trading? Why not start documenting your journey today – it’s a key step towards greater success!