Table of Contents
What are Technical Indicators?
Ever wonder what helps traders make sense of the market? Technical indicators are like secret weapons – mathematical calculations based on price and volume that offer clues about future movements! They sift through past data, searching for patterns to highlight potential buying or selling opportunities. Think of them as valuable insights into momentum, volatility, and how strong a trend really is.
Many traders rely on these signals to confirm their strategies and manage risk, minimizing those emotional decisions we all make sometimes. While no indicator can perfectly predict the future, learning how to use technical indicators effectively can definitely give you an edge. It’s something that takes practice and a good understanding of how markets actually work.
Defining Technical Indicators
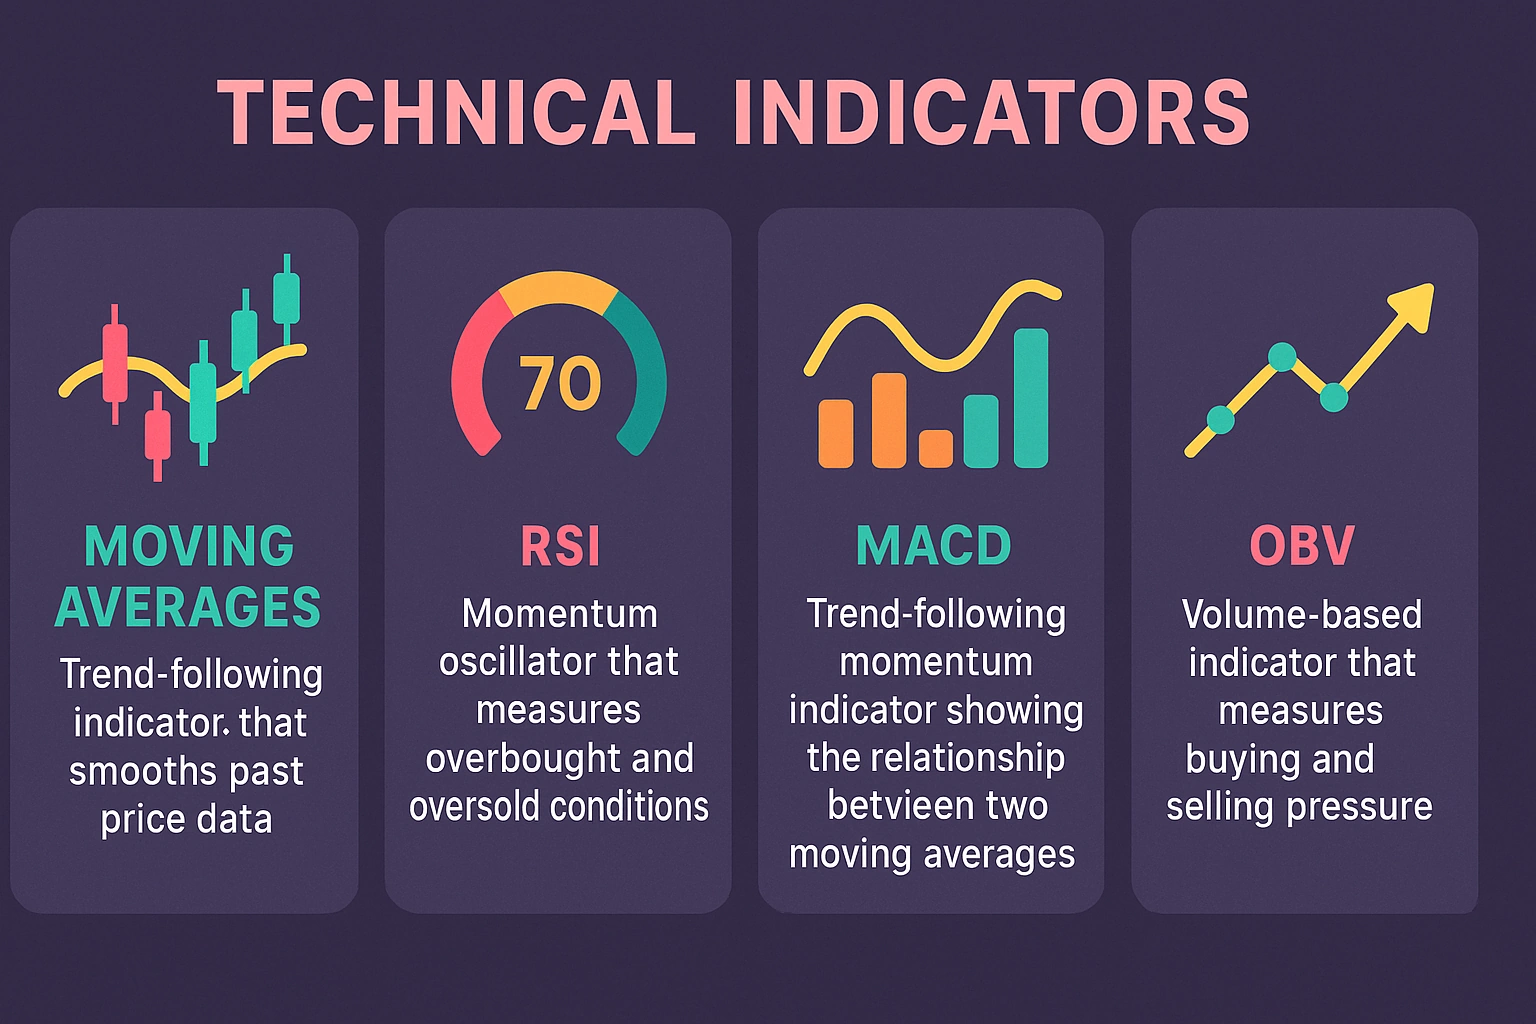
Ever wonder how traders peek into the future of the market? Technical indicators are like their secret tools – mathematical calculations using price and volume data that analyze past activity to suggest what might happen next. They help spot trends, gauge momentum shifts, and assess volatility, ultimately leading to more informed trading decisions. You’ll often hear about Moving Averages, RSI, and MACD; getting familiar with these can be really insightful! Just remember to pair them with other analysis for a complete picture.
Why Traders Use Them
Many traders turn to technical indicators when trying to gauge market shifts and identify potential opportunities—they’re like useful tools that spotlight trends and important price points. Ultimately, these signals aim to reduce risk while potentially increasing profits by providing data-driven insights. Moving Averages and RSI are popular examples; many use them to confirm their trading ideas or pinpoint ideal entry and exit times. Consistent application of technical indicators, combined with smart risk management, can really make a difference in your results.
Different Types of Indicators
Technical indicators are really helpful for understanding what’s happening in the market and making better trading decisions. You’ll typically find them grouped by trend – think Moving Averages – momentum, like the Relative Strength Index (RSI), or even volume analysis. Each one gives you a different look at price action, potentially hinting at where things might go next.

Key Concepts Before You Start
Gaining a handle on technical indicators is really important for feeling confident when you trade. Before diving into anything too complicated, let’s start with the basics – things like support and resistance levels; picture them as potential turning points in price action. It’s also helpful to look at volume, which shows how much activity there is—higher volume often suggests stronger conviction. Building a good foundation now will make learning easier down the road! Spotting chart patterns and understanding the difference between trend lines and moving averages are essential too. Mastering these fundamentals can really sharpen your ability to read market signals and make better choices. Want to learn more? Check out our guide on Moving Averages!
Timeframes and Chart Types
Knowing your timeframes really matters for creating impactful data visualizations! Line charts excel at showcasing trends over longer durations—imagine seeing sales climb year after year. For quick comparisons within a specific period, like monthly revenue, bar charts are fantastic. Just remember to clearly label what timeframe each chart represents; clarity is key! Simple visuals often convey insights best and help ensure accurate interpretation when choosing the right chart type.
Understanding Lagging vs. Leading Indicators
Ever noticed how revenue figures often reflect what’s already happened? That’s a lagging indicator. But what about website traffic or the cost of acquiring new customers – those hint at what’s to come! Understanding this distinction between leading and lagging indicators is truly vital for crafting a proactive business strategy. Keeping an eye on both ultimately sharpens your technical indicators and leads to smarter decisions.
Common Price-Based Technical Indicators
For traders, technical indicators are essential for analyzing price movements and finding those sweet spots for potential trades. Think of it as looking back at past patterns to get a sense of what might happen next – that’s essentially what they do! Many rely on historical price data to spot trends and shifts in momentum. You’ll often see folks using Moving Averages (MAs) to smooth out the price action and get a clearer view of the bigger picture, or the Relative Strength Index (RSI), which helps identify when an asset might be overbought or oversold. The Simple Moving Average (SMA) is also quite popular.
Here’s a quick look at some common ones:
- Moving Averages: These help you figure out which way the trend is headed.
- Relative Strength Index (RSI): It measures momentum and can signal potential reversals.
- Bollinger Bands: Useful for gauging volatility and spotting possible breakout points. Really, learning to understand these tools is a crucial step in improving your market analysis skills. https://www.investopedia.com/terms/t/technicalanalysis.asp
Moving Averages (MA)
For traders, technical indicator moving averages (MA) are a really useful tool! They essentially smooth out price data to make it easier to spot trends – think of averaging prices over, say, 50 or 200 days. You’ll often see the Simple Moving Average (SMA) and Exponential Moving Average (EMA), which gives more weight to recent prices, used frequently. Many look for buy signals when a price breaks above an MA, and vice versa. Combining different MAs can really refine your analysis; a shorter-term one crossing over a longer one could suggest growing momentum. Want to dive deeper? Check out this Investopedia explanation: https://www.investopedia.com/terms/m/movingaverage.asp
Simple Moving Average (SMA) Explained
The Simple Moving Average (SMA) is a really useful tool for looking at price charts – it’s all about smoothing things out to see trends more clearly. Think of it like averaging your grades across several tests; you get a better sense of how you’re doing overall! A 10-day SMA, for example, takes the average closing price from the last ten days, helping filter out some of that market noise and potentially highlighting shifts in direction. Want to learn more? Check it out here.
Exponential Moving Average (EMA) Explained
The Exponential Moving Average (EMA) is known for reacting quickly to price changes – much faster than a Simple Moving Average (SMA). It really focuses on what’s happening now, which makes it great for identifying short-term trends and helping traders stay flexible. Unlike the SMA, which treats all prices equally, the EMA gives more weight to recent activity; this provides a dynamic look at potential reversals.
Relative Strength Index (RSI)
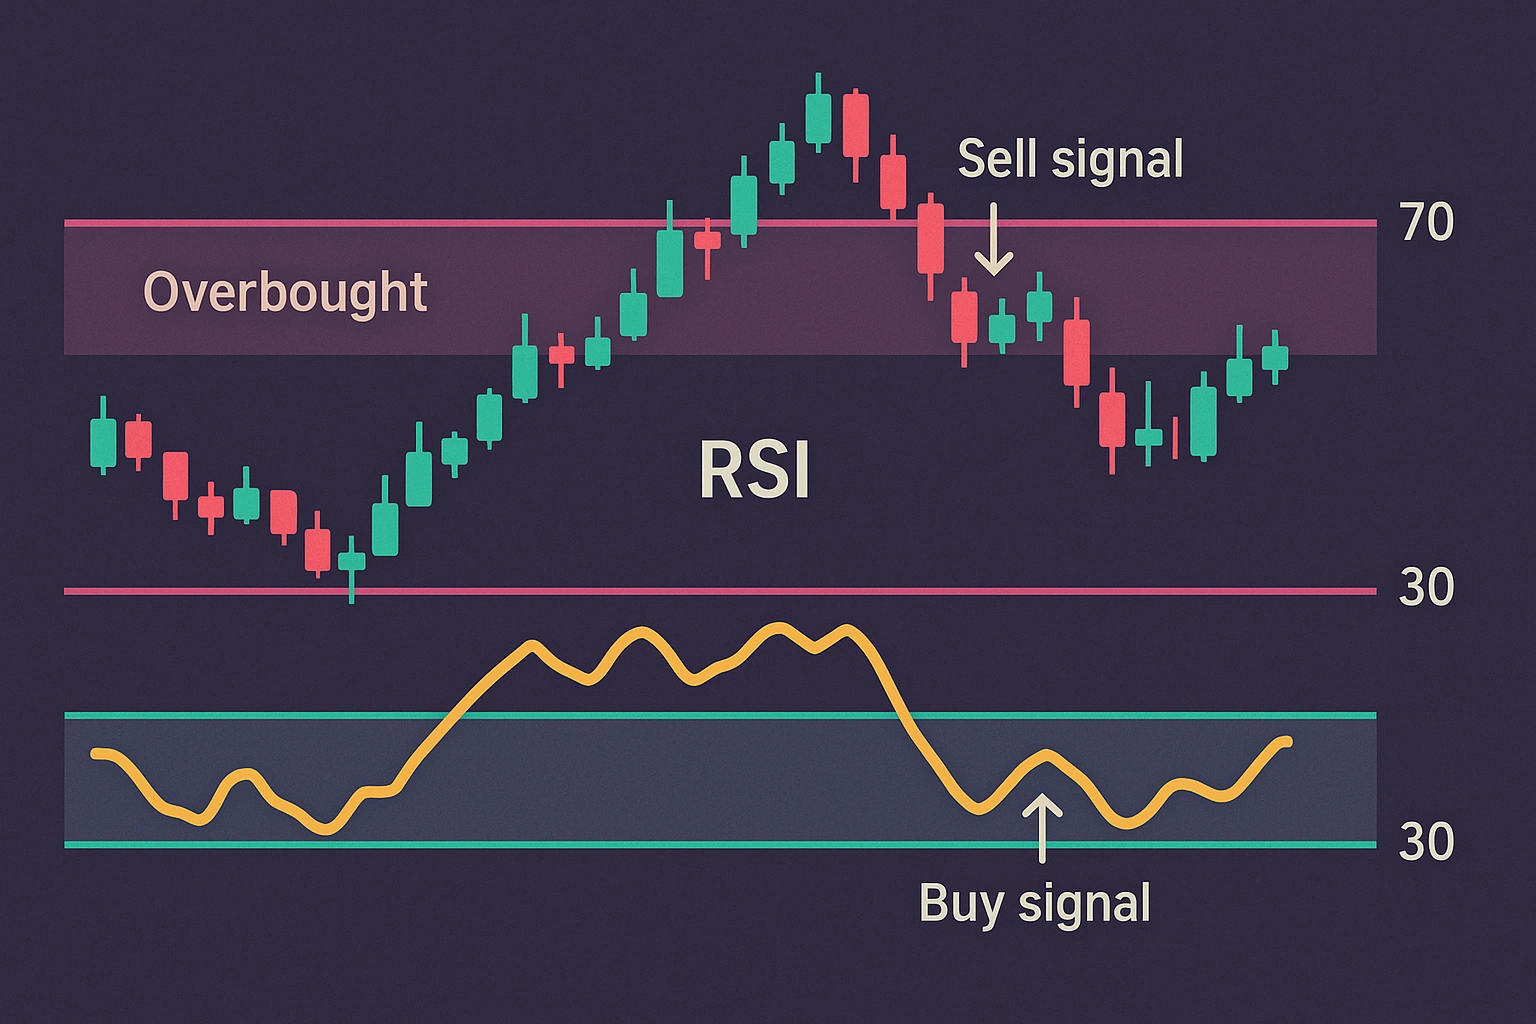
The Relative Strength Index (RSI) is a handy tool for understanding an asset’s momentum – essentially, how quickly its price has been changing. It’s like checking if something’s getting overheated or feeling a bit too chilled! The RSI runs on a scale of 0 to 100; typically, readings above 70 might suggest it’s overbought, while values below 30 could mean it’s oversold. While trading signals can come from these extremes, remember not to rely solely on the RSI. Combining it with other analysis will give you a more complete picture.
RSI Interpretation: Overbought & Oversold
The Relative Strength Index (RSI) is a fantastic tool for traders wanting to gauge market momentum. Ever notice when an asset’s price seems stretched? An RSI reading above 70 often hints at an overbought condition – like a rubber band about to spring back! Conversely, values below 30 might suggest it’s oversold, potentially signaling a rebound. Remember though, these aren’t hard-and-fast rules; always look at the broader context. Combining RSI with other indicators can really sharpen your trading strategy.

Moving Average Convergence Divergence (MACD)
The Moving Average Convergence Divergence, or MACD, is a popular tool traders use to identify changes in price trends. It works by comparing two exponential moving averages—typically 12-day and 26-day periods—and includes a signal line. The histogram provides a handy visual of their difference, simplifying interpretation.
You’ll often see folks looking for bullish crossovers (MACD rising above the signal) as potential buying opportunities, while bearish crossovers suggest selling. Keep an eye out for divergences too; when price moves differently than the MACD suggests, it could indicate a trend reversal. Want to learn more? Explore other technical indicators and level up your trading strategy!
MACD Components and Signals
The MACD indicator offers a unique look at market trends, breaking things down into three key parts. You’ve got the MACD line itself – that’s the difference between moving averages – plus a Signal Line (a nine-day EMA) and a Histogram to visualize their connection. Understanding these pieces is really important for using this technical indicator effectively.
Keep an eye out for crossovers, where the MACD line crosses above or below the Signal Line; they often point toward potential buy or sell signals. Also, divergence – when price action doesn’t quite match what you see on the Histogram – can be a subtle clue about shifting trends.
Volume-Based Technical Indicators
Understanding market behavior often involves looking beyond just price fluctuations – that’s where technical indicators focused on volume come into play. Essentially, these tools analyze both how prices move and the sheer number of shares or contracts being traded; a surge in volume frequently suggests widespread conviction behind a specific price shift. It’s like getting a sense of the crowd’s sentiment! Traders use them to gauge the strength of trends and anticipate potential reversals – a crucial skill for informed decision-making.
Several well-known examples exist, such as On-Balance Volume (OBV), which links price changes directly with volume activity. You’ll also find the Volume Price Trend (VPT) and the Accumulation/Distribution Line, both incorporating these factors. Just remember, while incredibly useful, no indicator is foolproof; occasional misleading signals can occur, especially in markets with low trading volume.
On Balance Volume (OBV)
On Balance Volume (OBV) is a clever way to link price changes with trading volume – it’s really a momentum indicator at its core. Imagine adding volume when prices climb, and subtracting it during declines; for example, strong closing prices alongside higher volume will definitely boost OBV. This gives you insight into buying or selling pressure. It’s quite helpful for identifying potential trend reversals too! Bullish divergences – where prices hit lower lows but OBV shows higher lows – can suggest a downtrend might be losing steam, while bearish divergences could signal weakness in an uptrend. Traders frequently use technical indicators like OBV to confirm trends and get a sense of what the market’s feeling.
OBV Interpretation
The On Balance Volume (OBV) indicator is a neat way to gauge buying and selling pressure – it essentially adds volume when prices rise and subtracts it during declines. A rising OBV often reinforces an uptrend, but a declining one could suggest weakness even as prices climb; understanding this relationship is really important for traders. Keep an eye out for bullish signals when OBV breaks above resistance, or bearish signs when it dips below support – correlating these trends with price action can offer valuable insights and help pinpoint good entry and exit points using technical indicators.
Volume Price Trend Analysis (VPTO)
Ever wonder what might influence future price movements? Volume Price Trend Analysis, or VPTO, offers a glimpse. Think of it as a map illustrating how prices and trading volume have interacted – making those key trends much easier to spot. Charts visually display these patterns, potentially guiding your buy or sell decisions. By comparing price changes with trading volume, VPTO reveals periods of accumulation or distribution. Exploring VPTO alongside other technical indicators can significantly improve your trading strategy; why not start learning today?
Combining Technical Indicators for Better Analysis
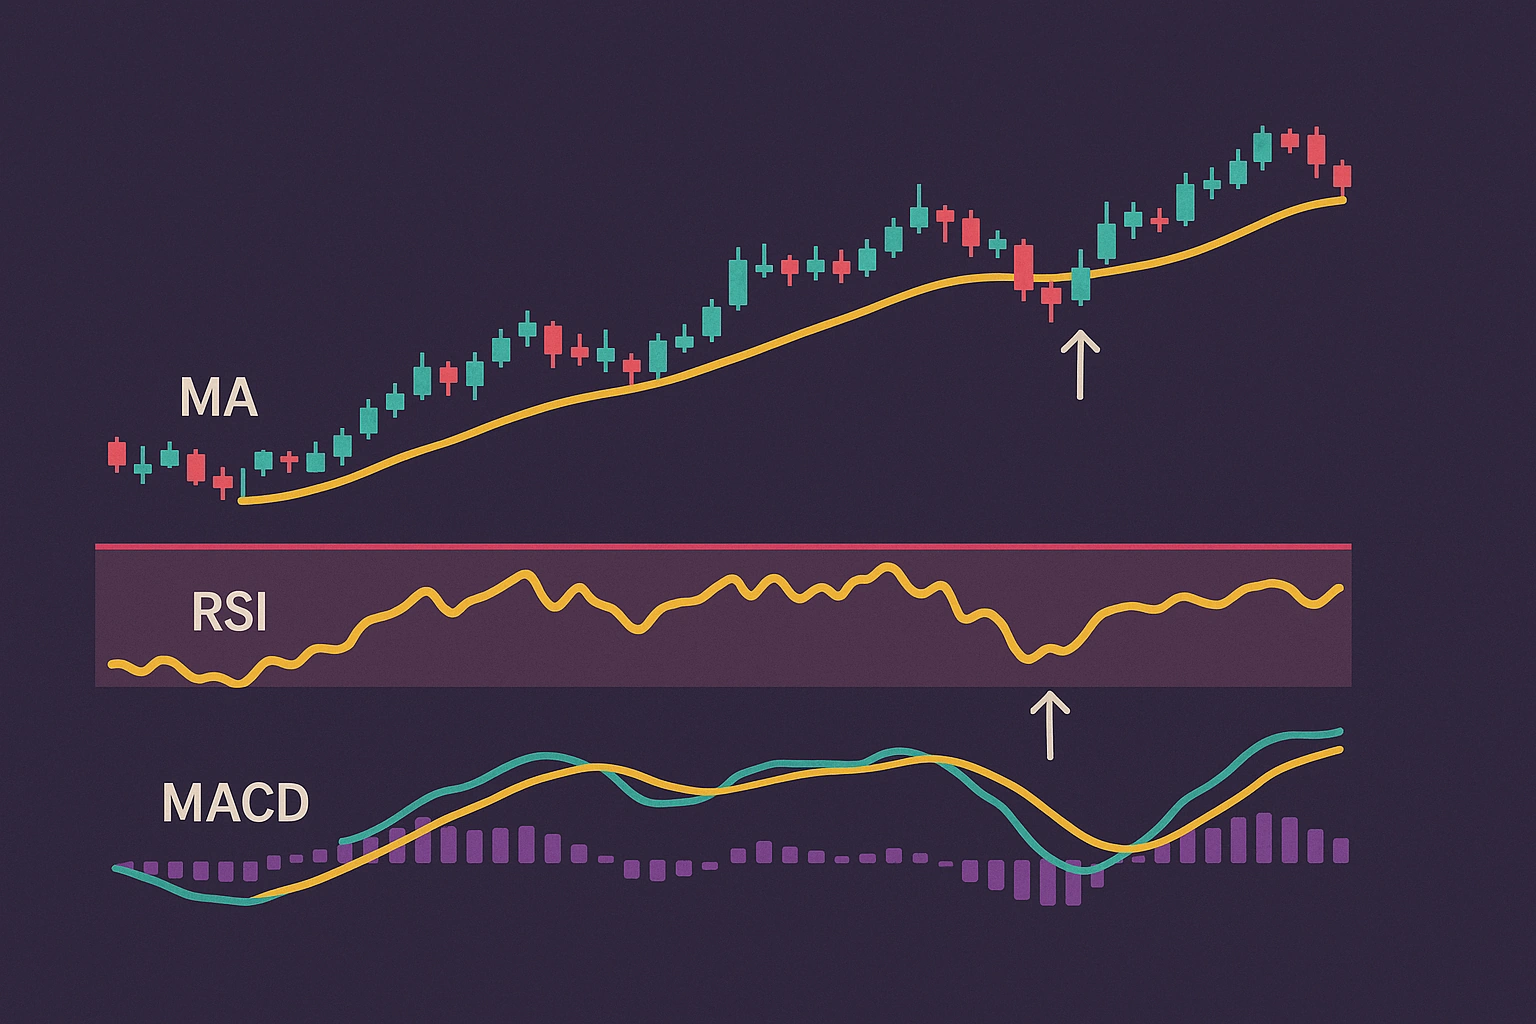
Analyzing the market can feel overwhelming, right? Relying on just one technical indicator often isn’t enough to paint a complete picture. It’s like trying to understand a complex story with only a single sentence – you miss so much! For example, the Relative Strength Index (RSI) might flag an asset as overbought, but confirming that with a trend indicator such as a Moving Average can help filter out false alarms and boost your certainty. This combined approach really strengthens your trading decisions.
Consider how MACD paired with volume analysis can effectively spotlight strong breakouts. Of course, even when using multiple technical indicators, risk management remains crucial – things like stop-loss orders are still essential. Diversifying your indicator selection and thoroughly backtesting any strategy you develop are also smart moves to keep in mind.
Using Multiple Indicators Together
Want to really level up your trading? Combining technical indicators thoughtfully can make a big difference. It’s not just about throwing every signal you see at the market; instead, look for those that work well together – where one indicator reinforces another. For example, seeing a bullish Moving Average crossover with an oversold Relative Strength Index (RSI) often suggests a good time to buy. And of course, remember risk management! No strategy is foolproof, so always use stop-loss orders and keep your position sizes in check. Understanding what each indicator does best is crucial.

Confirmation Strategies
Getting on the same page is vital, right? So, when sharing important ideas, try rephrasing them and genuinely asking what folks think – it really shows you’re listening! Plus, using active voice makes everything much easier to grasp. Concrete examples always help too. To make sure everyone’s aligned, consider summarizing clear steps with numbered lists or regularly checking for understanding; that way, you can fine-tune your message.
Avoiding False Signals with Combination Analysis
Finding genuine trading opportunities often means avoiding those tricky false signals. A helpful approach is combination analysis – it examines how different technical indicators work together, rather than relying on just one. Think of a sudden price spike with low volume; that could easily be a temporary blip! To really confirm any signal, always consider data from multiple factors for a clearer picture and fewer errors. Want to refine your strategy? Dive deeper into technical indicators – it’s a great place to start learning!
Limitations of Technical Indicators
Technical indicators can be incredibly helpful when you’re looking at price charts and trying to find good trading opportunities – but it’s important to remember they aren’t perfect! It’s often said that technical analysis is like looking in the rearview mirror; it gives you a sense of where prices have been, but doesn’t guarantee where they’re headed. After all, these signals are built on historical data, so predicting future market movements perfectly isn’t possible.
Relying too heavily on indicator readings can sometimes lead to missed opportunities or even bad trades, especially when the market is unpredictable or unexpected news comes out. So, think of technical indicators as just one piece of a bigger picture. Confirmation from multiple indicators, combined with an understanding of what’s happening in the broader market, is really important. Blending technical analysis with fundamental research and solid risk management will lead to stronger decisions and help you navigate potential challenges.
The Risk of Over-Optimization
Technical indicators are helpful for trading analysis, right? But when it comes to SEO, going overboard can actually be counterproductive. It’s a bit like keyword stuffing or creating fake links – those tactics might seem tempting at first, but they often create a poor experience for visitors and send the wrong signals to search engines. Really, focusing on rankings above quality frequently leads to disappointing results.
Market Conditions and Indicator Effectiveness
Recent market swings have certainly created some turbulence, haven’t they? It’s been interesting watching how different technical indicators react – the Relative Strength Index (RSI), for example, has occasionally given us confusing signals amidst those rapid price shifts. On the other hand, moving averages seem to be holding up pretty well; they do a great job of smoothing out the short-term noise and highlighting longer-term trends. Understanding these variations in indicator performance is really important for traders like you. Ready to tackle this? Check out our guide on technical indicators – it’s packed with insights to help you make more informed trading choices!
Ready to take action?
Join Flows.Trading today and unlock powerful tools to analyze, plan, and execute your trades like a pro — all in one intuitive platform.