Time is money. Money is time.
The fast-paced world requires minting money quickly. Different types of chart patterns provide the precise information to gain money with excellence. Trade in the global market is a lucrative method to earn good profits. However, it is essential to understand how things work.
Start with the fundamentals. Understand how chart patterns work to make the best of new opportunities.
Make exceptional financial gains by analyzing different types of chart patterns in trading. Traders use these charts to get equipped with the nature of the market. It requires experience to gain accuracy, but never too late to start learning about them with a keen eye.
Learn about the variations and effects of these charts to make major profits on your finances.
What are Chart Patterns?
Chart patterns are an interpretation of set price action. The approach of chart pattern analysis is getting recognized for the pattern being followed currently. These charts are a crucial aspect of technical analysis and require a core understanding to make a move.
Advanced charting tools help analyze and understand the price movements. The outcome of every chart pattern varies depending on the volatility of the market. The bullish and bearish environments have an immense effect on the chart patterns.
Different Types of Chart Patterns
Let’s discuss the various types of chart patterns in the market. Learn their differences and understand how you could project the prices accordingly.
1. Head and Shoulder
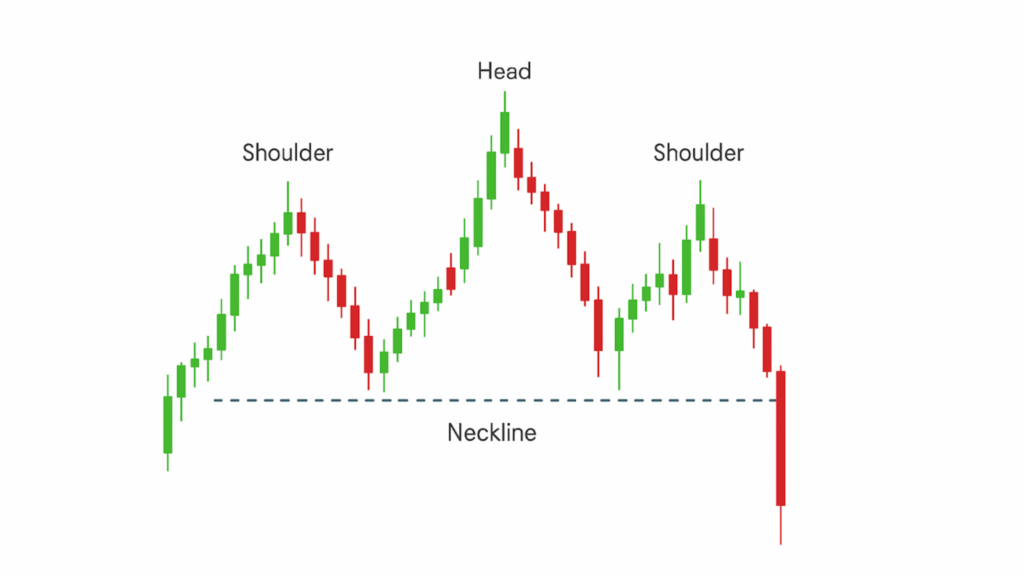
It is a common type of chart pattern where smaller peaks are located on either side of a large peak on the chart. All three highs should fall on the same support level called the neckline. The head and shoulders is a bearish reversal pattern. The first two attempts will rebound while the final attempt will break out in downtrend.
2. Double Top
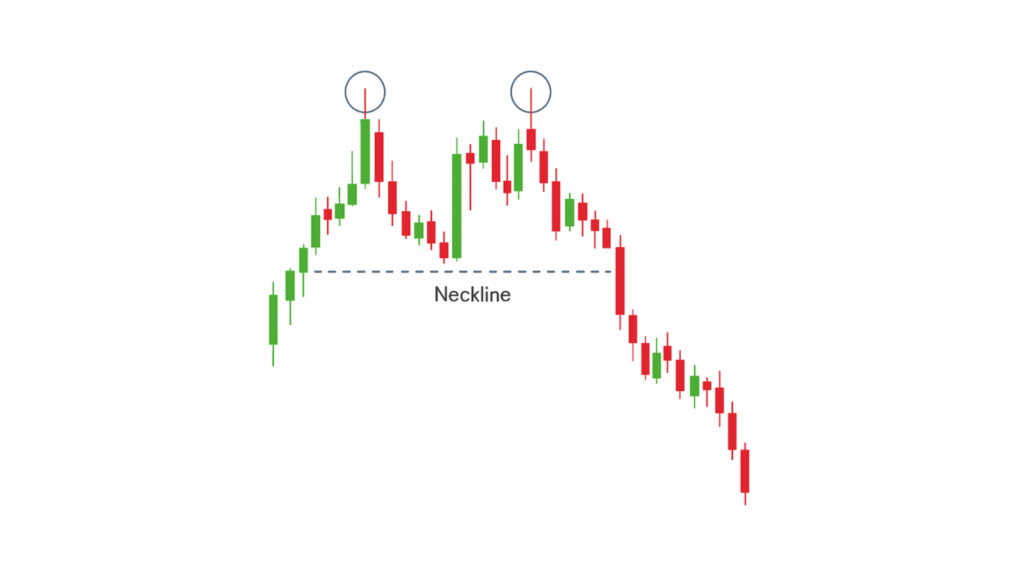
The formation of this type of chart pattern is made after the market price reaches two consecutive highs with small declines in the middle. You will notice an M formation on the chart. It is a bearish reversal pattern, where the asset price has fallen below the support level.
3. Double Bottom
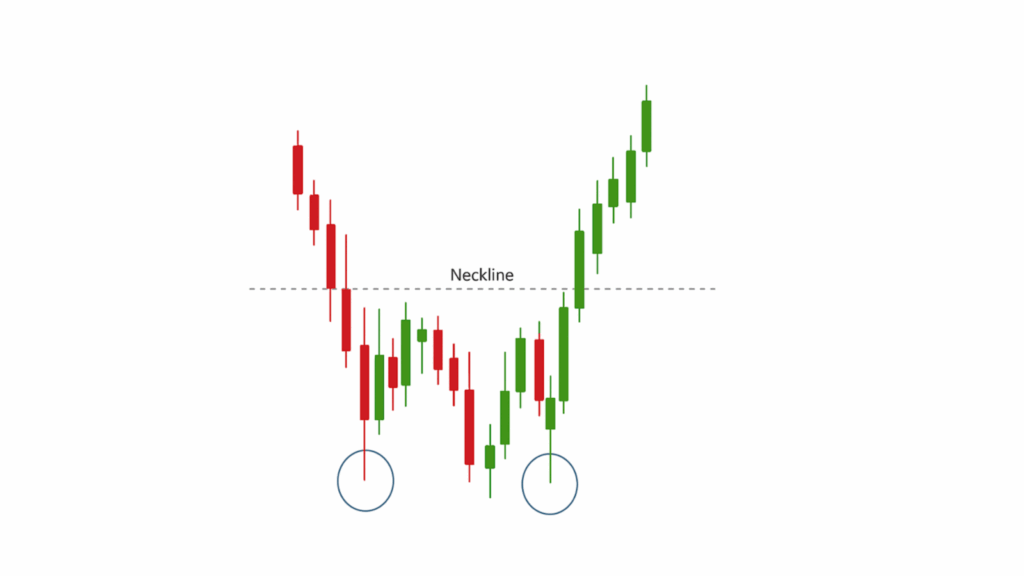
In contrast to the double top, the double bottom is formed when the market price makes two attempts for breakthrough without succeeding. In between, there will be a temporary price rise to the level of resistance. It creates a W formation on the chart.
4. Rounding Bottom
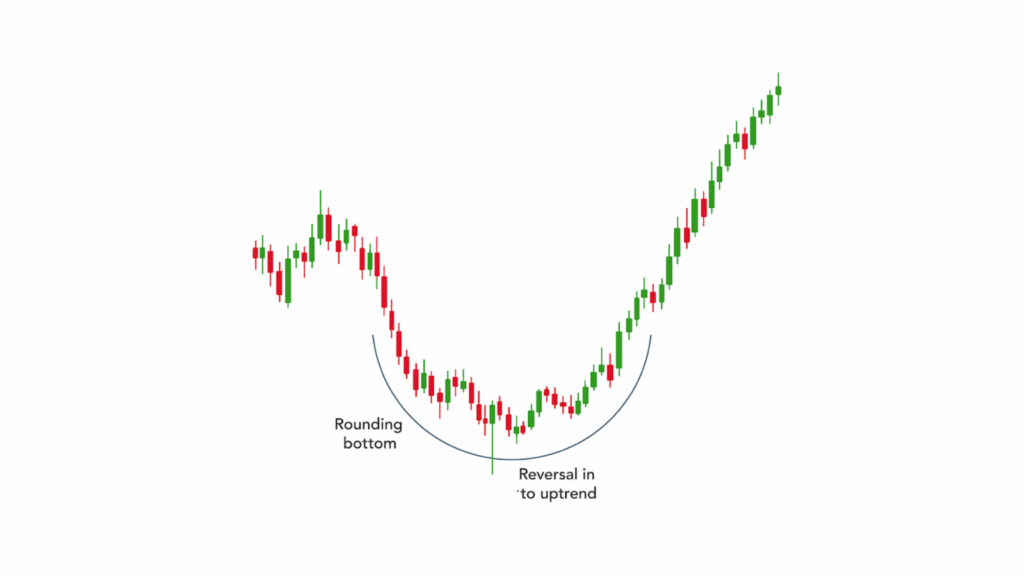
It is a reversal pattern on the chart. The advanced charting tools will recognize this as a U-shaped formation. It showcases a bullish continuation. This chart pattern shows the asset price in a downward trend before reversal with the bullish uptrend.
5. Wedges Chart Patterns
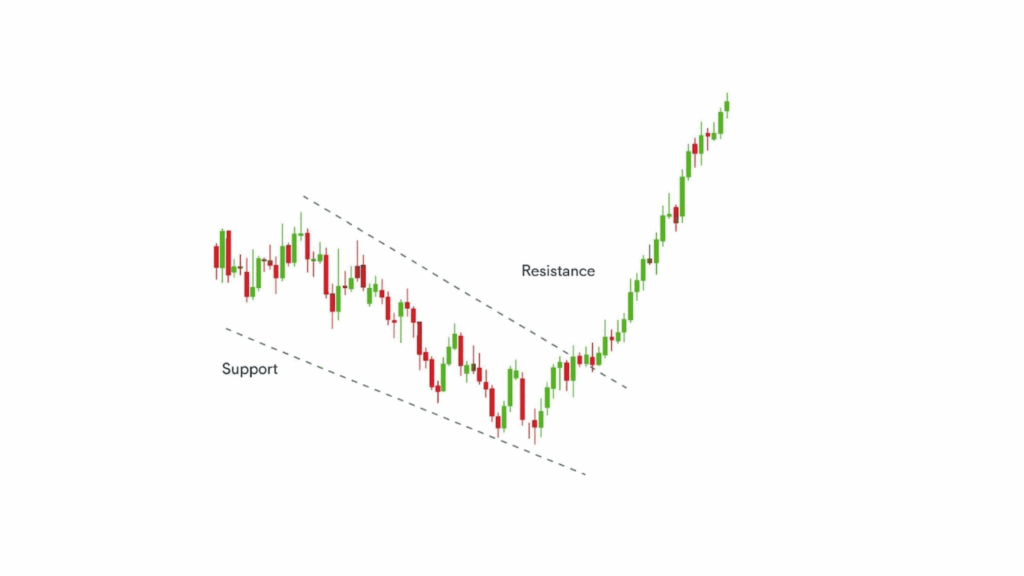
The wedge chart pattern has the lines tighten towards each other. The lines coincide as the volume declines in the chart progression. The wedge pattern could either rise or fall as the on-market breakout. The wedges move with the price of the assets.
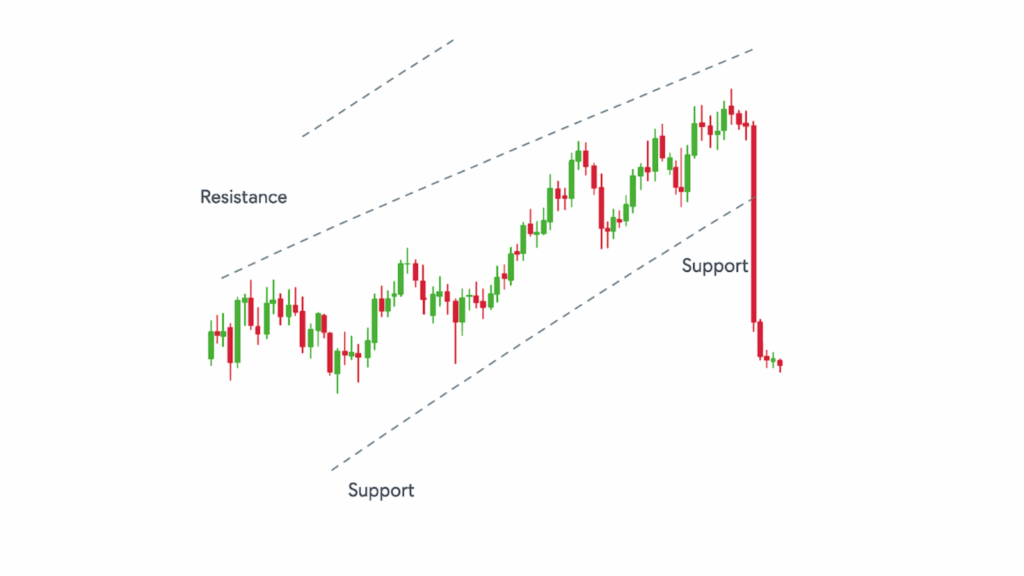
6. Flag Chart Pattern
The chart pattern of flags is created after the asset goes through an upward trend, followed by consolidation. It is considered a continuation pattern with the price action affecting the flag formation. The bullish flag has both lines pointing downwards, while the bearish flag has both lines pointing upwards.
7. Cup and Handle
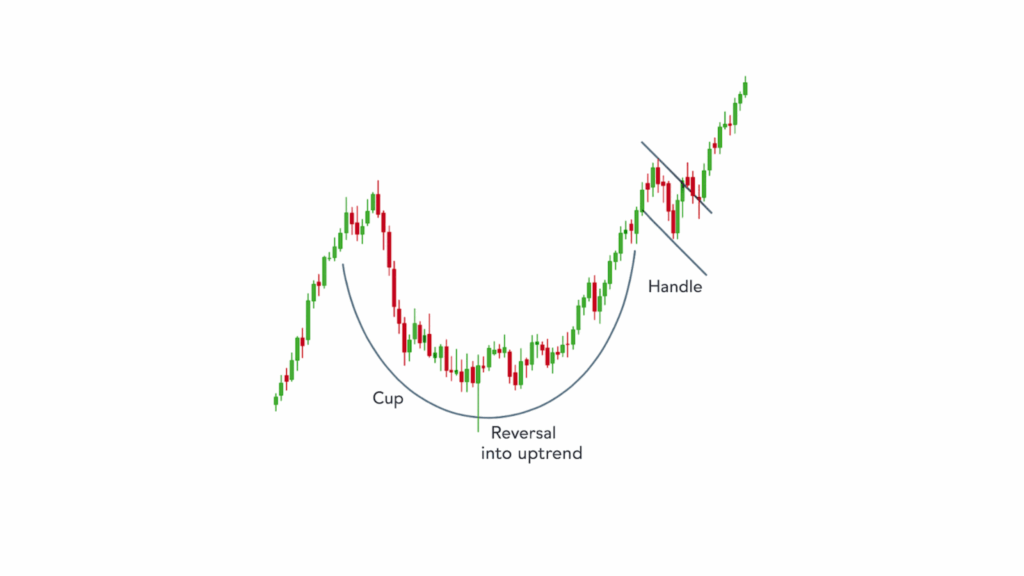
A bullish continuation pattern is the cup and handle. The cup looks similar to the rounded bottom chart pattern, and the handle looks similar to the wedge pattern. The price of assets will cause a temporary retracement, confined to two parallel lines in the graph.
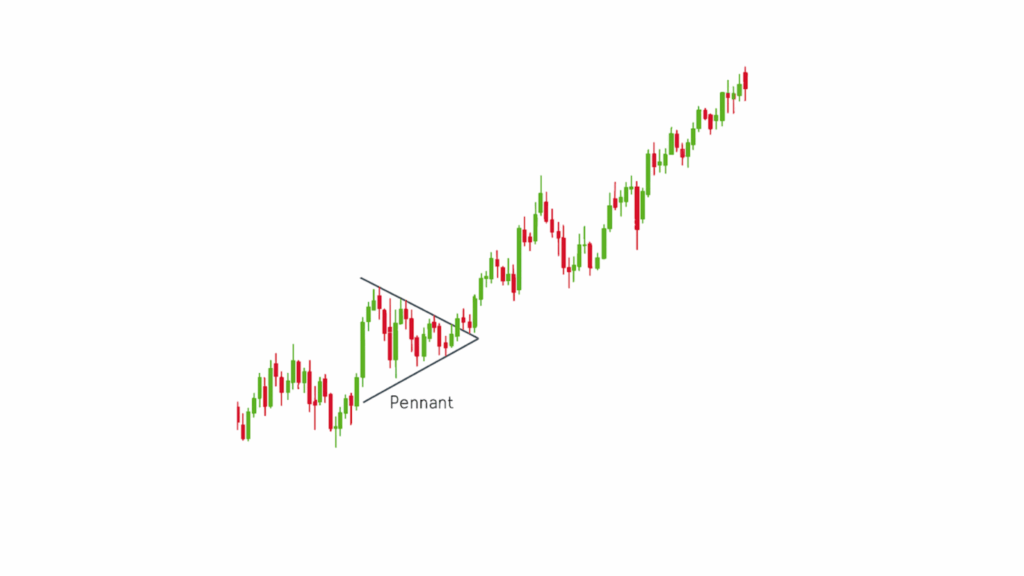
8. Symmetrical Triangle
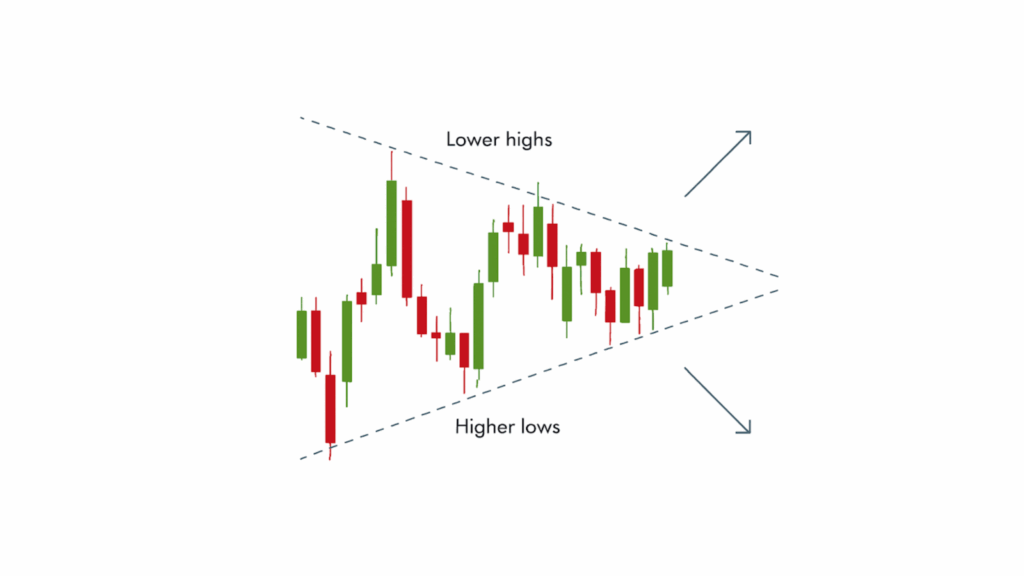
This type of chart pattern occurs when two trend lines are approaching one another while progressing. It could be bullish or bearish depending on the market. It is considered a continuation pattern, exhibiting that the market will continue in the same direction.
Conclusion
The realm of trading is brimming with complex concepts. Chart patterns are useful indicators in identifying how the market will perform in the near future. Learn more with the help of the best advanced charting tools. Explore Flows Trading today!